Download

1 / 18
180 likes | 308 Views
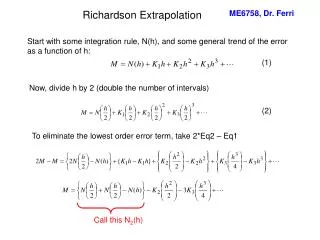
Interpolation and extrapolation. Tu /W 9/4,5 Honors Physics. Interpolation and Extrapolation. A hypothesis can be used to predict the results of observations or the existence of other phenomena. There are two types of predictions that can be made.

E N D
Interpolation and extrapolation Tu/W 9/4,5Honors Physics
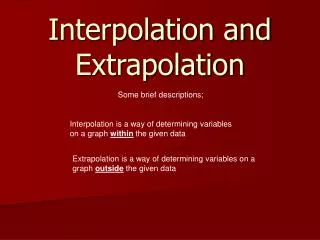
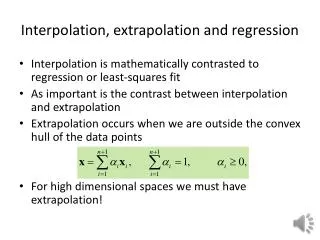
Interpolation and Extrapolation • A hypothesis can be used to predict the results of observations or the existence of other phenomena. • There are two types of predictions that can be made. • One is called extrapolation; the other is called interpolation.
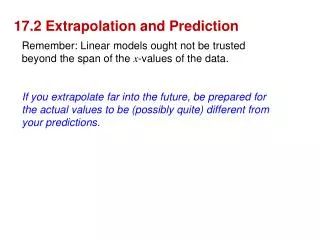
extrapolation • Extrapolated predictions are those that are made outside of the known data points. • MEMORY TIP: • “exit” = how to get outside; • “extrapolate” = predicted outside the data points • Trends in the known data can often be used to make accurate extrapolated predictions; however, this is not always the case.
Danger of extrapolation • A young man's parents kept track of his height through the years, as shown in this graph.
Danger of extrapolation • Extrapolation shows that Bryan will be about 10 feet tall when he's 30 years old. • What faulty assumption was made in this extrapolation?
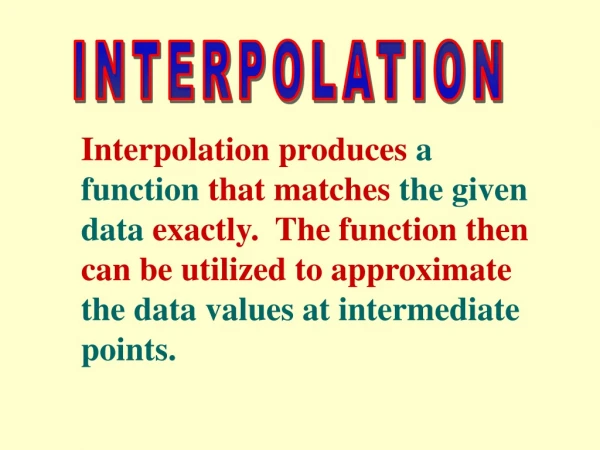
INTERPOLATION • Interpolated predictions are those that are made between known data points. • MEMORY TIP: • “inter”state highways go between states; • “inter”polations predict between data points
INTERPOLATION • An interpolation of this data would lead one to the prediction that Bryan was about 4.5 ft tall at the age of 14. • Is this a reasonable prediction?
PREDICTING USING BEST-FIT LINES/CURVES AND THEIR EQUATIONS • Thanks to the genetic influence of my mother’s brothers (who range from 6’2” to 6’7”), my oldest child is 6’4”. Here’s his height data through the years:
Note that the equation of the best-fit line for this data is given by • y = 2.593x + 31.144 • Translating this into something meaningful for height and age gives • Height, in = (2.593 in/yr)(Age,yrs) + 31.144 in • This means that if you need to find out the height when he was 5 years 3 months old, you’d calculate • Height, in = (2.593inches/year)(5.25 yrs) + 31.144 in • = 44.75725 inches. • Does this seem reasonable? Why/why not?
How old was this child when he was 5’0” tall? • First, remember that the basic relationship is • Height, in = (2.593 in/yr)(Age,yrs) + 31.144 in • Let’s translate this into H for height in inches and A for age in years: • H = 2.593A + 31.144 • BUT • Remember that you’re asked to find the Age at a certain Height, NOT the Height at a certain Age! • To do this, it’s time for ALGEBRA.
H = 2.593A + 31.144 • To find the Age, we have to solve for A. • First, subtract 31.144 from both sides: • H - 31.144 = 2.593A + 31.144 – 31.144 • leaving us with • H – 31.144 = 2.593A • Next, divide both sides by 2.593: • which results in • A ALGEBRATIME!!
Finishing up • A • So to find his age when he was 5’0” tall (5.0 ft = 60.0 inches), substitute in 60.0 for H: • A • A = 11.1 years • Does this seem reasonable? Why/why not?
Is it accurate? Is it precise? • You can use information from your graph to determine the accuracy and precision of your data. • Remember . . . • Accuracy is how close the experimental data is to the accepted value; • Precision is how close your points are to each other; in this case, how close all the points are to being on that best-fit line.
For next time: • Make sure you have all questions answered and your graph/data printed BEFORE you come to class next time. • Download the Scientific Notation worksheet and complete it on your own paper. • Practice Scientific Notation questions online. Be ready for a quiz next class period!