Download

1 / 22
320 likes | 1.05k Views
Section 8-2 Basics of Hypothesis Testing. Rare Event Rule for Inferential Statistics. If, under a given assumption, the probability of a particular observed event is exceptionally small, we conclude that the assumption is probably not correct. Components of a Formal Hypothesis Test.

E N D
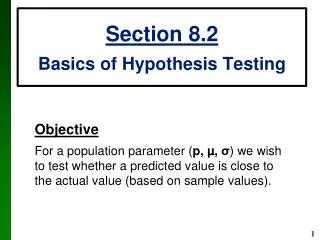
Section 8-2 Basics of Hypothesis Testing
Rare Event Rule for Inferential Statistics If, under a given assumption, the probability of a particular observed event is exceptionally small, we conclude that the assumption is probably not correct.
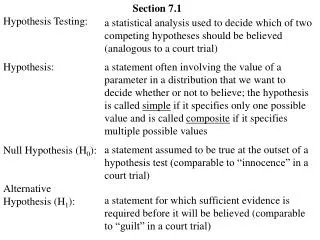
Null Hypothesis: The null hypothesis (denoted by ) is a statement that the value of a population parameter (such as proportion, mean, or standard deviation) is equalto some claimed value. We test the null hypothesis directly. Either reject or fail to reject .
Alternative Hypothesis: The alternative hypothesis (denoted by ) is the statement that the parameter has a value that somehow differs from the null hypothesis. The symbolic form of the alternative hypothesis must use one of these symbols: .
Note about Forming Your Own Claims (Hypotheses) If you are conducting a study and want to use a hypothesis test to support your claim, the claim must be worded so that it becomes the alternative hypothesis.
Note about Identifying and Figure 8-2
Example: • The mean annual income of employees who took a statistics course is greater than $60,000. • The proportion of people aged 18 to 25 who currently use illicit drugs is equal to 0.20. • The standard deviation of human body temperatures is equal to 0.62 degrees F. • The majority of college students have credit cards. • The standard deviaton of duration times of the Old Faithful geyser is less than 40 sec. • The mean weight of airline passengers (including carry-on bags) is at most 195 lbs.
Test Statistic The test statistic is a value used in making a decision about the null hypothesis, and is found by converting the sample statistic to a score with the assumption that the null hypothesis is true.
Test Statistic - Formulas Test statistic for proportion Test statistic for mean Test statistic for standard deviation
Critical Region The critical region (or rejection region) is the set of all values of the test statistic that cause us to reject the null hypothesis. For example, see the red-shaded region in the previous figure.
Significance Level The significance level (denoted by) is the probability that the test statistic will fall in the critical region when the null hypothesisis actually true. This is the sameintroduced in Section 7-2. Commonchoices forare 0.05, 0.01, and 0.10.
P-Value The P-value (or p-value or probabilityvalue) is the probability of getting a value of the test statistic that is at least as extreme as the one representing the sample data, assuming that the null hypothesis is true. Critical region in the left tail: P-value = area to the left of the test statistic Critical region in the right tail: P-value = area to the right of the test statistic Critical region in two tails: P-value = twice the area in the tail beyond the test statistic
Caution Don’t confuse a P-value with a proportion p. Know this distinction: P-value = probability of getting a test statistic at least as extreme as the one representing sample data p = population proportion
Decision Criterion P-value method: Using the significance level : If P-value ,reject. If P-value , fail to reject .
Decision Criterion • Find the P-value and determine the decision about the null hypothesis if the test is conducted at the 0.05 level of significance. • H1: m < 95 and z = -1.89 • H1: p is not equal to 0.6 and z = 1.62 • H1: m > 41 and z = 2.05
Wording of Final Conclusion Figure 8-7
Caution Never conclude a hypothesis test with a statement of “reject the null hypothesis” or “fail to reject the null hypothesis.” Always make sense of the conclusion with a statement that uses simple nontechnical wording that addresses the original claim.
State the final conclusion. Original claim: The percentage of blue M&Ms is greater than 5%. Decision: Fail to reject the null hypothesis. Original claim: The percentage of Americans who know their credit score is equal to 20%. Decision: Fail to reject the null hypothesis. Original claim: The percentage of on-time U.S. airline flights is less than 75%. Decision: Reject the null hypothesis. Example
Controlling Type I and Type II Errors For any fixed , an increase in the sample size nwill cause a decrease in For any fixed sample size n, a decrease in will cause an increase in . Conversely, an increase in will cause a decrease in . To decrease both and , increase the sample size.
Hypothesis Test –P-Value Method • State the null and alternative hypotheses in symbolic form. • Select the level of significance based on the seriousness of a type 1 error. The values of 0.05 and 0.01 are most common. • Identify the statistic that is relevant to this test and determine its sampling distribution (such as normal z, t, or chi-square.) • Find the test statistic and find the P-value. Draw a graph and show the test statistic and P-value. Technology may be used for this step. • Reject H0 if the P-value is less than or equal to the level of significance, , or Fail to reject H0 if the P-value is greater than . • Restate the previous decision in simple non-technical terms, and address the original claim.