Download
1 / 1
10 likes | 94 Views
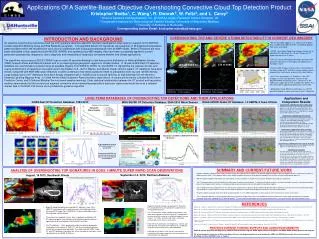
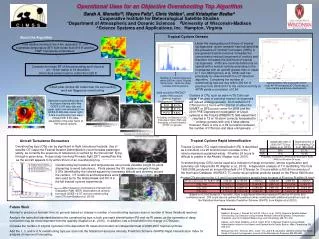
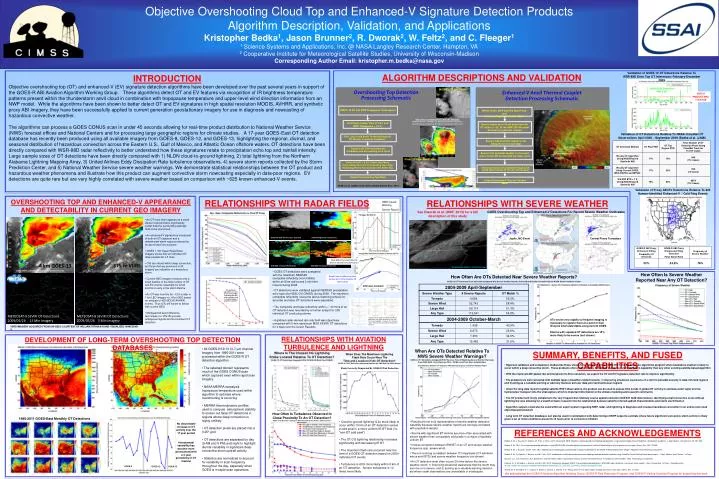
Overshooting Top Detection Processing Schematic. Enhanced-V Anvil Thermal Couplet Detection Processing Schematic. Objective Overshooting Cloud Top and Enhanced-V Signature Detection Products Algorithm Description, Validation, and Applications

E N D
Overshooting Top Detection Processing Schematic Enhanced-V Anvil Thermal Couplet Detection Processing Schematic Objective Overshooting Cloud Top and Enhanced-V Signature Detection Products Algorithm Description, Validation, and Applications Kristopher Bedka1, Jason Brunner2, R. Dworak2, W. Feltz2, and C. Fleeger1 1 Science Systems and Applications, Inc. @ NASA Langley Research Center, Hampton, VA 2 Cooperative Institute for Meteorological Satellite Studies, University of Wisconsin-Madison Corresponding Author Email: kristopher.m.bedka@nasa.gov MODIS 0.25 km Visible NWS Issued Warning Severe Report INPUT: IR BT and NWP Tropopause Temperature INPUT: IR BT, NWP 250 hPa Wind Field, and Overshooting Top Detection Mask IRW-Texture Candidate Pixels: Anvil BT Sampling White Pinwheels: Candidate OT Significantly Colder Than Anvil Black Pinwheels: Cloud Top BT Pattern Too Uniform=Not an OT Find Pixels Colder Than 217.5 K and NWP Tropopause + 2.5 K Search region up to 40 km away from the OT within +/- 45° of the NWP 250 hPa wind direction for potential couplet Filter List of Cold Pixels To Identify Regional BT Minima: Overshoot Candidates Ensure that potential couplet is not along the anvil cloud edge Compute BT Difference Between Candidates and Surrounding Anvil Cloud Ensure that potential couplet is a focused area of warm BT surrounded by colder anvil Peak Reflectivity Aloft Shortly Before Satellite OT Observation Final OT Detection Pixels Validation of GOES-12OT Detections Relative To WSR-88D Echo Top OT Inferences: February-December 2009 ALGORITHM DESCRIPTIONS AND VALIDATION INTRODUCTION Objective overshooting top (OT) and enhanced-V (EV) signature detection algorithms have been developed over the past several years in support of the GOES-R ABI Aviation Algorithm Working Group. These algorithms detect OT and EV features via recognition of IR brightness temperature patterns present within the thunderstorm anvil cloud in combination with tropopause temperature and upper-level wind direction information from an NWP model. While the algorithms have been shown to better detect OT and EV signatures in high spatial resolution MODIS, AVHRR, and synthetic proxy ABI imagery, they have been successfully applied to current generation geostationary imagery for use in diagnosis and nowcasting of hazardous convective weather. The algorithms can process a GOES CONUS scan in under 45 seconds allowing for real-time product distribution to National Weather Service (NWS) forecast offices and National Centers and for processing large geographic regions for climate studies. A 17-year GOES-East OT detection database has recently been produced using all available imagery from GOES-8, GOES-12, and GOES-13, highlighting the regional, diurnal, and seasonal distribution of hazardous convection across the Eastern U.S., Gulf of Mexico, and Atlantic Ocean offshore waters. OT detections have been directly compared with WSR-88D radar reflectivity to better understand how these signatures relate to precipitation echo top and rainfall intensity. Large sample sizes of OT detections have been directly compared with 1) NLDN cloud-to-ground lightning, 2) total lightning from the Northern Alabama Lightning Mapping Array, 3) United Airlines Eddy Dissipation Rate turbulence observations, 4) severe storm reports collected by the Storm Prediction Center, and 5) National Weather Service severe weather warnings. We demonstrate statistical relationships between the OT product and hazardous weather phenomena and illustrate how this product can augment convective storm nowcasting especially in data-poor regions. EV detections are quite rare but are very highly correlated with severe weather based on comparison with ~625 known enhanced-V events. Pixels With BT > 6.5 K Colder Than Mean Surrounding Anvil Are Overshooting Tops, Flag Remaining Pixels That Compose The Entire Top Ensure presence of a relatively large anvil cloud downstream of the OT and couplet Broad Peak in Reflectivity Near Surface At Or After Satellite OT Observation 18203 GOES Detections FAR: 5.9% Output Overshooting Top Mask Output Enhanced-V Thermal Couplet Mask 208 Cases Included GOES-R PRODUCT SPEC < 25% FAR Bedka et al. (JAMC, 2010, 2012), Bedka (Atmos Res., 2011) METEOSAT-9 SEVIRI OT Detections 2009/05/26 15 Min Imagery Validation of OT Detections Relative To NASA CloudSat OT Observations April 2008 – September 2009 (Bedka et al. (JAMC 2012)) Validation of Proxy ABI EV Detections Relative To 625 Human-Identified Enhanced-V / Cold Ring Events OVERSHOOTING TOP AND ENHANCED-V APPEARANCE AND DETECTABILITY IN CURRENT GEO IMAGERY RELATIONSHIPS WITH RADAR FIELDS RELATIONSHIPS WITH SEVERE WEATHER GOES Overshooting Top and Enhanced-V Detections For Recent Severe Weather Outbreaks See Dworak et al. (WAF, 2012) for a full description of this study Portage, WI Storm • An OT most often appears as a small cluster of pixels that is significantly colder than the surrounding optically thick cirrus anvil cloud • An enhanced-V signature is composed of both an OT signature and a downstream warm region produced by an above anvil cirrus plume • GOES 1-min Super Rapid Scan imagery shows that an individual OT often persists for ≤ 5 mins • OTs are natural within deep convection, but those that are prominent in IR imagery are indicative of a hazardous storm • Current GEO imagery resolves only a small fraction of the total number of OT and EV events, especially for small storms or early in the storm lifetime • An OT was found to be ~12 K colder in 1 km LEO imagery vs. 4 km GEO based on analysis of 425 MODIS/AVHRR events. Thus OTs will harder to detect with current GEO • Multispectral band difference techniques (i.e. WV-IR) provide ambiguous signals and inconsistent OT detection GOES VIS With OT Detection: 2015 UTC GOES IR Brightness Temperature Joplin, MO Event Central Plains Tornadoes Joplin, MO / Midwest Event: 5/22-23 375 m VIIRS 4 km GOES-13 WSR-88D Composite Reflectivity WSR-88D Precipitation Echo Top • GOES OT detections were compared with the maximum NEXRAD composite reflectivity (via Unidata) within an 8 km radius and 3 min time interval during 2008 How Often Is Severe Weather Reported Near Any OT Detection? How Often Are OTs Detected Near Severe Weather Reports? GOES-12 OT Detections From 2004-2009 Compared With Severe Weather Reports Collected and Quality Controlled by the NOAA Storm Prediction Center • OT detections were validated against NEXRAD precipitation echo tops (via NSSL/OU-CIMSS) during 2009. The maximum composite reflectivity (using the above matching criteria) for accurate and false OT detections were separated • The composite and base reflectivity within +/- 30 mins of an OT detection was recorded by a human analyst for 208 individual OT producing storms • A gridded radar-derived rain rate field was objectively compared with 5-min rapid-scan MSG SEVIRI OT detections for 4 days over the Czech Republic The maximum separation in curves occurs at 52.5 dBZ, indicating that this value could be used to monitor product quality in real-time METEOSAT-8 SEVIRI OT Detections 2009/05/26 5 Min Imagery Comparison of rapid-scan MSG SEVIRI OT detections with radar-derived rain rate over the Czech Republic. Courtesy of V. Bliznak and Z. Sokol (Czech Institute of Atmosphere Physics) OTs evolve very rapidly so frequent imaging is necessary to capture them at a point in their lifecycle when detectable using current GOES Storms with repeated OT detections are 15% more likely to be severe (not shown) VIIRS IMAGERY ACQUIRED FROM UW-SSEC COURTESY OF WILLIAM STRAKA III AND VISUALIZED IN MCIDAS-V RELATIONSHIPS WITH AVIATION TURBULENCE AND LIGHTNING DEVELOPMENT OF LONG-TERM OVERSHOOTING TOP DETECTION DATABASES • All GOES-8/12/13 10.7 μm channel imagery from 1995-2011 were processed within the GOES-R OT detection algorithm • The selected domain represents much of the GOES CONUS scan which captured even within rapid scan imagery • NASA MERRA reanalysis tropopause temperature used within algorithm to estimate where overshooting is occurring • MERRA thermodynamic profiles used to compute atmospheric stability to screen out false OT detections in regions where deep convection is highly unlikely • OT detection pixels are placed into a 0.25° grid • OT detections are separated by day (9 AM and 9 PM) and night to highlight diurnal variability in significant deep convective storm updraft activity • Statistics are normalized to account for variability in scan frequency throughout the day, especially when GOES is in rapid-scan operations When Are OTs Detected Relative To NWS Severe Weather Warnings? GOES-12 OT Detections Compared With The Issue Time Of Matching Severe Weather Warnings From 2004-2009. Only Warnings With < 30 Min Lead Time Were Included Here SUMMARY, BENEFITS, AND FUSED CAPABILITIES Where Is The Closest CG Lightning Strike Located Relative To OT Detection? GOES-12 OT Detections Compared With 2008 NLDN Data Over CONUS When Does The Maximum Lightning Flash Rate Occur Near The Time and Location Of An OT Detection? GOES-12/13 OT Detections Compared Northern AL LMA Data For 2500+ Events • Rigorous validation and comparison studies like those shown here indicate that the GOES-R OT and EV detection algorithms pinpoint where hazardous weather is likely to occur within a deep convective storm. These products offer a more reliable hazardous convective storm detection capability than any other existing satellite-based algorithm • With the improved ABI spatial (4x) and temporal (3x-30x) resolution, we expect the OT and EV signature detection rate to improve significantly • The products are well correlated with multiple types of weather-related hazards, 1) improving situational awareness of a storm’s possible severity in data-rich land regions and 2) acting as a valuable warning or advisory decision aid over data-poor land and ocean regions • Given the long data record of global satellite IR BT observations, the product can be used to assess time trends in global OT activity to estimate water vapor and ice hydrometeor transport into the stratosphere which is important information to the climate modeling and research community • The OT product will nicely complement the very frequent but relatively coarse spatial resolution GOES-R GLM observations, identifying small convective cores without lightning but also allowing for a wealth of basic research into the relationship between satellite-inferred updraft characteristics and storm electrification • Algorithm outputs could also be used within an expert system ingesting NWP, radar, and lightning to diagnose and nowcast hazardous convection in an end-to-end cloud object based framework • Long term OT detection databases can also be used in combination with data mining of NWP output to estimate where future significant convective storm activity is likely given a set of initial conditions present 6-12 hours prior to convective initiation Study Currently Supported By GOES-R Risk Reduction How Often Is Turbulence Observed In Close Proximity To An OT Detection? GOES-12 OT Detections Compared With 2005-2008 United Airlines EDR Turbulence Observations 1995-2011 GOES-East Monthly OT Detections • Cloud-to-ground lightning is 2x more likely to occur within 10 km of an OT detection versus a cold pixel in a more uniform IR BT field (i.e. “non-OT cold pixel”) • The OT-CG lightning relationship increases significantly with decreasing IR BT • The maximum flash rate occurred near the time of a GOES OT detection based on2500+ individual OT events • Turbulence is 60% more likely within 5 km of an OT detection. Severe turbulence is 12 times more likely • Results are not truly representative of severe weather detection capability because severe weather reports are strongly correlated with population density • Storms with significant BT minima are more often associated with severe weather than comparably cold pixels in a region of spatially uniform BT • Inverse correlation between IRW BT of an OT and severe weather frequency (esp. severe wind). • There is a strong correlation between OT magnitude (OT minimum minus anvil BTD) and severe weather frequency (not shown) • An OT detection most often occurs 30 mins before the severe weather event: 1) improving situational awareness that the storm may soon be or is severe, and 2) serving as a valuable warning decision aid where radar observations are unavailable or inadequate No discernable increase in OT activity over the 17 year period Interannnual variability has become more pronounced with a 4 year periodicity in OT maxima REFERENCES AND ACKNOWLEDGEMENTS Bedka, K. M., J. Brunner, R. Dworak, W. Feltz, J. Otkin, and T. Greenwald, 2010: Objective satellite-based overshooting top detection using infrared window channel brightness temperature gradients. J. Appl. Meteor. And Climatol., 49, 181-202. Bedka, K. M., 2011: Overshooting cloud top detections using MSG SEVIRI infrared brightness temperatures and their relationship to severe weather over Europe. Atmos. Res., 99, 175-189. Bedka, K. M., J. Brunner, and W. Feltz, 2011: Objective overshooting top and enhanced-V signature detection for the GOES-R Advanced Baseline Imager: Algorithm Theoretical Basis Document. Bedka, K. M., R. Dworak, J. Brunner, and W. Feltz, 2012: Validation of satellite-based objective overshooting cloud top detection methods using CloudSat Cloud Profiling Radar observations. J. Appl. Meteor. And Climatol. In Press. Brunner, J.C., S.A. Ackerman, A.S. Bachmeier, and R.M. Rabin, 2007: A quantitative analysis of the enhanced-V feature in relation to severe weather. Wea. Forecasting, 22, 853–872. Dworak, R., K. M. Bedka, J. Brunner, and W. Feltz, 2012: Comparison between GOES-12 overshooting top detections, WSR-88D radar reflectivity, and severe storm reports. Wea. Forecasting. In Press. Available online at: http://angler.larc.nasa.gov/site/people/data/kbedka/Dworaketal_OT_NEXRAD_SevereWx_WeaForecasting2012.doc Setvak, M. K. M. Bedka, D. T. Lindsey, A. Sokol, Z. Charvat, J. Stastka, P. K. Wang, 2012: A-Train observations of deep convective storm tops. Atmos. Res. In Press. GOES-8 GOES-12 GOES-13 We acknowledge the GOES-R Aviation Algorithm Working Group, GOES-R Risk Reduction Program, and GOES-R Visiting Scientist Program for supporting this work