Download

1 / 29
320 likes | 542 Views
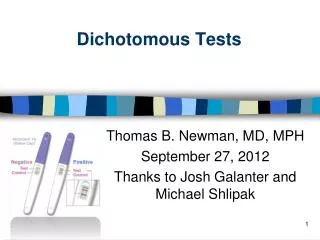
Dichotomous Tests (Tom). What tests do. Negative test. Positive test. Reassurance. Order a Test. Treatment. Their results change the probability of disease. T+. T-. 0%. 100%. A good test moves us across action thresholds. The best tests are definitive.

E N D
What tests do Negative test Positive test Reassurance Order a Test Treatment • Their results change the probability of disease T+ T- 0% 100% • A good test moves us across action thresholds. • The best tests are definitive
Post-Test Probability of Disease Depends on 2 Things • Where you started from (low, medium, high) • Length and direction of the “arrow” • Basic paradigm: • What we thought before + test result = what we think now • Prior probability + LR from test = post-test probability • LR = P(Result|Disease)/P(Result|No Disease)
Assessing information from dichotomous tests (review): Sensitivity=a/(a+c) Specificity =d/(b+d) Positive predictive value (PPV) = a/(a+b); Negative predictive value (NPV) d/(c+d) Prior probability = P(D); Posterior probability = P(D|test result)
False-negative confusion Sensitivity of rapid strep test is 85% Therefore, false negative rate is 15% 15% is too high, so always culture to confirm negative rapid strep tests
What’s wrong? 2 definitions of “false negative rate” 1-sensitivity = FN/(TP+FN). This one is easier because it’s (assumed to be) constant. 1 - negative predictive value = FN/(FN+TN). This one is harder because it depends on prior probability, but it is the one that should determine clinical decisions. Strep No Strep Total Rapid Test + TP FP TP+FP Rapid Test - FN TN TN+FN TP+FN FP+TN
If prior probability of strep = 20% False negative rate (def #2) = 15/407 = 3.7% NNC (number needed to culture) = 1/.037 = 27 to identify 1 false negative rapid test. (Pre-test probability of 20%) At some prior probability of strep, culture after negative quick test is not indicated. (Assumes 98% specificity)
Similar examples: Sensitivity of UA for UTI is only 80%, therefore always culture after a negative UA Sensitivity of CT scan for subarachnoid hemorrhage is only 90%, therefore always do LP after a negative CT
Importance of Sampling Scheme If sampling separately from Disease+ and Disease– groups (case-control sampling), cannot calculate prevalence, positive predictive value, or negative predictive value.
Dx Test:Case-Control Sampling Sensitivity = a/(a + c) Specificity = d/(b + d)
Dx Test: Cross-sectional Sampling Prevalence = (a + c)/N Positive Predictive Value = a/(a + b) Negative Predictive Value = d/(c + d)
R. henselae titers and Cat Scratch Disease* Authors stated negative predictive value = 38/42 = 90.5%. Is there a problem? *Zangwill, N Engl J Med. 1993;329:8-13. EBD Problem 3.2
Example from Chapter 3 65-year-old woman with mammogram suspicious for malignancy Pre-test probability ≈ 0.015 LR(“suspicious for malignancy”) ≈ 100 Post-test probability = ?
Update Pre-Test Probability Using LR(test result) Convert pre-test probability (P) to pre-test odds. Pre-Test Odds = P/(1-P) Calculate LR. P(result|D+)/P(result|D-). Post-Test Odds = Pre-Test Odds × LR Convert post-test odds to post-test probability. Prob = Odds/(1+Odds)
Update Pre-Test Probability Using LR(test result) 1) Pre-test probability P = 0.015 Pre-test odds = P/(1-P) ≈ 0.015 2) LR(“Suspicious for Malignancy”) = 100 3) Post-Test Odds = 0.015 × 100 = 1.5 4) Post-test probability = Odds/(1+Odds) = 1.5/2.5 = 0.60
Threshold Model • Single disease (D+,D-) with single treatment (no further testing available) • Cost of failing to treat D+ = B • Cost of treating D- unnecessarily = C • Treat if P(D) > C/(C+B) • C/(C+B) = Treatment Threshold Probability = PTT Pauker SG, Kassirer JP.. N Engl J Med. 1975 Jul 31;293(5):229-34.
Pauker SG, Kassirer JP.. N Engl J Med. 1975 Jul 31;293(5):229-34.
Introduce a Dichotomous (+/-) Test • P(+|D+) = Probability of positive test “given” D+ = Sensitivity • P(-|D-) = Probability of negative test “given” D- = Specificity • P(+|D-) = 1 – Specificity or “False Positive Rate” • P(-|D+) = 1 – Sensitivity of “False Negative Rate” • T = Cost of Test
Pauker SG, Kassirer JP. N Engl J Med. 1980 May 15;302(20):1109-17.
Assumptions in the Threshold Model Threshold Model: • One disease • One dichotomous test • Only two post-test options: treat and no treat Real world: • Multiple possible diseases • Multiple possible test results (not just +/-) • Multiple possible tests • Multiple post-test options including observation and additional testing
2) Multilevel Tests (Michael) Likelihood ratios for results other than “+” or “-”