Download
1 / 13
130 likes | 136 Views
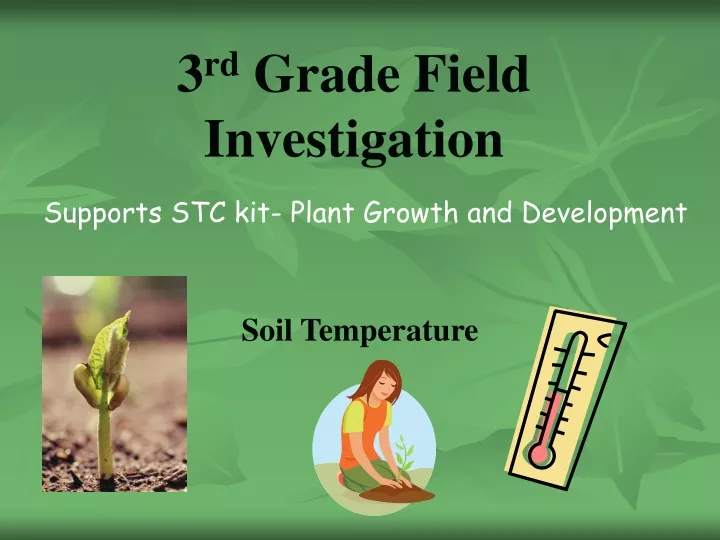
3 rd Grade Field Investigation. Supports STC kit- Plant Growth and Development. Soil Temperature. Collect and Draw Seeds. Compare Wisconsin Fast Plants with Plants Outdoors. Sample Chart of Plant Needs for Growth. CO2. Compare where plants get Space and Heat. Space. Heat.

E N D
3rd Grade Field Investigation Supports STC kit- Plant Growth and Development Soil Temperature
Compare Wisconsin Fast Plants with Plants Outdoors Sample Chart of Plant Needs for Growth CO2
Compare where plants get Space and Heat Space Heat
Minimum Soil Temperatures for Sprouting 32° F 70° F Spinach Lima Beans
Focus Question: Which location would allow seeds to sprout earliest in the spring?
Investigation Question: • Which location the north side or the south side of the building has the highest soil temperature 5 cm below the surface?
Investigation • Practice measuring soil temperature • Prediction • Description of study site • Compare 2 locations (changed variable) • Measure and record soil temperature (measured variable) • Measure soil temperature 5 cm into ground, wait 1 minute, read thermometer while in ground (kept the same variables) • Multiple trials
Analyze DataFinding Median or Mode • Individually • Class North Location Soil Temperatures ° F 48 46 48 46 48 42 46 48 50 41 42 43 44 45 46 47 48 49 50 51 52 53 54 55 56 57 58 59 60 50 52 54 56 58 50 52 54 54 54 South Location Soil Temperatures ° F
Writing Conclusions • Answer the investigative question (use words from the question). • Support your answer with qualitative data (less, more) and quantitative data (median/mode temperatures). • Tell whether or not the data support your prediction. If not, how has your thinking changed?
Pre and Post Tests Averages 3rd Grade Soil Temperature Investigation Note: Data from 47 students from Seattle School District