Download
1 / 34
350 likes | 443 Views
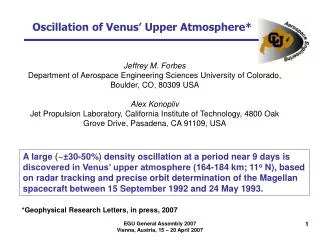
Vertical Wavenumber Spectra of Gravity Waves in the Venus and Mars Atmosphere. *Hiroki Ando, Takeshi Imamura, Bernd Häusler , Martin Pätzold. Radio occultation of Venus atmosphere. Ⅰ. Vertical profiles of the temperature are obtained from the frequency variation of the radio wave.

E N D
Vertical Wavenumber Spectra of Gravity Waves in the Venus and Mars Atmosphere *Hiroki Ando, Takeshi Imamura, Bernd Häusler, Martin Pätzold
Radio occultation of Venus atmosphere Ⅰ. Vertical profiles of the temperature are obtained from the frequency variation of the radio wave. Ⅱ. Vertical profiles of the mixing ratio of H2SO4 vapor are obtained from the intensity variation of the radio wave. Ⅲ. Vertical profiles of the electron density in the Venus ionosphere are obtained from the frequency variation of the radio wave. For the purpose of testing the Akatsuki radio science system, radio waves transmitted from Venus Express were observed at Usuda Deep Space Center and analyzed to obtain five vertical temperature profiles.
Radio occultation technique Bending angle Emission angle Tyler et al.(1987) ① Doppler shift ⇒ emission angle (θ) ② θ, trajectory information ⇒ bending angle (α), impact parameter (a) ③ α, a, Abel transform ⇒ refraction index (μ), altitude (ρ), density (N) ④ N, ρ, hydrostatic equilibrium, ideal gas law ⇒ pressure (p), temperature (T)
Procedure to obtain vertical temperature profiles Temporal development of Doppler frequency 20000 10000 Doppler frequency (Hz) 0 impact parameter vs bending angle 6160 -10000 trajectory information -20000 Time (second) 6130 6000 0 4000 2000 100 vertical profile of refractive index 6100 Abel transform 0.0 3.0 6.0 9.0 80 Bending angle (degree) Altitude (km) 60 ・ hydrostatic equilibrium ・ ideal gas law 40 (Refractive index) – 1.0 0.0 4.0×10⁻⁴ 8.0×10⁻⁴ 1.6×10⁻³ 1.2×10⁻³
Vertical temperature profiles 100 90 80 Wavy structures exist ! 61°N 70 54°S Altitude (km) 60 71°N 12°N 50 85°N 40 30 500 300 400 200 250 150 350 450 Temperature (K)
Procedure to obtain small-scale temperature fluctuations 100 Original temperature profile T0 : Background temperature T’ : Perturbation 90 Fitting function is subtracted. 80 90 Altitude (km) 70 Cubic function (≡ T0) 85 60 80 Altitude (km) 50 75 40 70 450 200 250 300 350 400 150 Temperature(K) 65 Cubic function is fitted to the original temperature profile within the altitude range above (65-85 km) and below (42-52 km) the cloud layer. -0.01 -0.005 0.01 0 0.005 Normalized temperature perturbation T’/T0
Procedure to obtain wavenumber spectra 90 Spectral density within the altitude range above (65-85 km) and below (42-52 km) the cloud layer is obtained by Fourier Transform. 85 80 Altitude (km) 106 75 104 102 70 1 65 10-2 Spectral density -0.01 -0.005 0.01 0 0.005 10-4 Normalized temperature perturbation T’/T0 10-6 10-8 10-10 10-12 0.01 0.1 10 100 1 Vertical wavenumber (km-1)
Saturation of Gravity Waves(Lindzen et al., 1981) As a gravity wave propagates vertically, its amplitude increases with z exponentially. ( ∝ exp(z/2H) ) Cold Warm If this keeps on increasing, convective instability occurs at the altitude Z = Zb ; ∂θ/∂Z=∂(θ0+θ’)/∂Z<0 Then gravity wave breaks at this altitude.
Saturation of Gravity Waves(Lindzen et al., 1981) Above the altitude Zb, the amplitude of the wave is limited by turbulent diffusion and becomes constant.(Saturation) Z=Zb As the wave propagates vertically, the amplitude continues to increase.
Vertical wavenumber spectra of gravity waves When convective instability occurs, u’ 〜 c〜ω/k 〜 N/m Kinetic energy of the gravity wave can be written as |u’|2/2 〜 N2/2m2 Thus the spectral density Fu’(m) can be described as Fu’(m) = (N2/2m2)/m = N2/2m3 The spectral index for saturated gravity waves is -3. (Smith et al., 1987; Tsuda et al., 1989) N : Brunt=Väisälä frequency g : gravity acceleration By comparing the observed spectral density with theoretical one, we can examine whether gravity waves are saturated or not.
Above the cloud layer (65-85 km) 108 × × Model + : 11°N, : 54°S, : 61°N, □ : 71°N, ■ : 85°N, — : Model + 106 104 102 1 Normalized spectral density (km s4) 10-2 10-4 10-6 10-8 10-10 less than Fresnel radius 10-12 0.1 0.01 1 10 100 Vertical wavenumber (km-1)
Below the cloud layer (42-52 km) 106 × + : 11°N, : 54°S, — : Model 104 Model 102 1 Normalized spectral density (km s4) 10-2 ※ Within this altitude range, spectral density only at low and middle latitude region is obtained. 10-4 10-6 less than Fresnel radius 10-8 1 10 100 0.1 Vertical wavenumber (km-1)
Summary (Gravity waves in the Venus atmosphere) Ⅰ. For the purpose of testing the Akatsuki radio science system, radio waves transmitted from Venus Express were observed at UDSC and analyzed to obtain five vertical temperature profiles. The analysis tools have no defects. Ⅱ. We analyzed small-scale temperature fluctuations, assuming that they are associated with gravity waves. Moreover we obtained vertical wavenumber spectrum within the altitude range above the cloud layer (65-85 km) and below it (42-52 km). Ⅲ. Above the cloud layer, gravity waves do not seem to be saturated. On the other hand, they seem to be saturated below the cloud layer.
Background ◆ Numerical study Barnes (1990), Theodore et al. (1993) and Joshi et al. (1995) : GCM ⇒ They examinedthe propagation characteristic ofgravity waves that are generated by the topographic effects in the Martian atmosphere by using GCM. ◆ Observation Creasy et al. (2006a) : Radio Science (MGS) Creasy et al. (2006b) : Accelerometer (MGS) ⇒ They detected gravity waves and examined their dependences on the topography and local time. Heavens et al. (2010) : Infrared spectrometer (MRO) ⇒ They found convective instability in the middle atmosphere (〜70 km) and calculated the acceleration rate of the mean flow.
Procedure Basically the procedure is based on Creasy et al. (2006a). 40 35 T0 : fitted function T’ : perturbation 30 The fitted function was subtracted from the original profile. 25 Tangential height (km) 20 15 10 5 Tangential height (km) 0 170 180 190 200 210 220 Temperature (K) T’/T0 Cubic function is fitted to the original temperature profile within the altitude range 3-37 km. Normalized temperature deviation
Saturation of Gravity Waves(Mars Atmosphere) Following Tsuda et al. (2002), I analyzed the data separately for two altitude regions, that is, 3-20 km and 20-37 km. The spectral density is obtained by using FFT within each altitude region and classified by the season and latitude. (The wavelength is assumed to be 2.5-10 km.)
Results (3-20 km) Normalized spectral density (km s4) red : 45N-75N, green : 15N-45N, blue : 15S-15N, pink : 45S-15S, aqua : 75S-45S Vertical wavenumber (km-1)
Results (20-37 km) Normalized spectral density (km s4) red : 45N-75N, green : 15N-45N, blue : 15S-15N, pink : 45S-15S, aqua : 75S-45S Vertical wavenumber (km-1)
Results • Gravity waves are not saturated below the altitude 40 km. ⇒ This is not consistent with the results of Theodore et al. (1993) and Joshi et al. (1995). • Judged from the shape of spectrum, the source of gravity wave might not be topographic effects. ⇒ What is the source of gravity waves ? • The spectral density increases within the northern high latitude region in the Martian winter and spring.
Discussion ①(Why are gravity waves not saturated ?) The amplitude of the gravity wave cannot increase because radiative damping is dominant in the Martian lower atmosphere (Eckermann et al. 2011). λz = 2.5 km λz = 5.0 km • Barnes (1990), Theodore et al. (1993) and Joshi et al. • (1995) do not consider the effect of radiative damping.
Discussion ②(What is the source of the gravity wave?) ・ In previous numerical simulation studies, the source of the gravity wave is thought to be the topographic effects. (ex ; Barnes (1990), Joshi et al. (1995)) ・ From the observation result, there is a rough correlation between the activity of the gravity wave and the topography only in the equatorial region. (ex ; Creasy et al. (2006)) The correlation between the spectral density and the Martian topography does not seem to be good.
Results (3-20 km) Normalized spectral density (km s4) red : 45N-75N, green : 15N-45N, blue : 15S-15N, pink : 45S-15S, aqua : 75S-45S Vertical wavenumber (km-1)
Discussion ②(What is the source of the gravity wave?) ・ There seemed to be a good correlation between the spectral density and the amount of solar radiation. ・ Moreover topographic effects will also contribute to the enhancement of spectral density within the region near the equator.
Discussion ③(Why the spectral density is increased in the Martian winter and spring within the northern high latitude region?) Within the northern high latitude region, very strong westerly wind exists around the altitude 30-40 km in the winter and spring. ⇒ Are gravity waves generated by jet instability ?
Discussion ③(Why the spectral density is increased in the Martian winter and spring within the northern high latitude region?) Fall Winter Spring Summer
Discussion ③(Why the spectral density is increased in the Martian winter and spring within the northern high latitude region?) Model 20-37 km 3-20 km Normalized spectral density (km s4) Vertical wavenumber (km-1)
Summary1 (Mars atmosphere) • I analyzed the Radio Science data obtained in MGS mission and detected the gravity wave, assuming that its vertical wavelength is 2.5-10 km. 2. Vertically propagating gravity waves can grow at the northern high latitude region in the Martian winter. • Gravity waves are not saturated below 40 km. • Thus Hadley circulation might play a role of transporting dust particles or water vapor within the lower atmosphere.
Summary2 (Mars atmosphere) 5. The source of the gravity wave might not be the topographic effect. ⇒ The amount of solar radiation might be associated with the spectral density. 6. Within the northern high latitude region, spectral density is enhanced with the altitude increasing in the Martian winter and spring. ⇒ Jet instability generates gravity waves ?
Observation information Date Ingress/Egress Longitude Latitude 2010. 4. 30 egress 183° 61°N 2010. 5. 6 ingress 197° 12°N egress 201° 71°N 2010. 6. 16 ingress 129° 54°S egress 98° 85°N
Atmospheric Stability (65-85 km) 90 85 80 Altitude (km) 75 70 65 20 -10 -5 45 0 40 5 10 15 25 30 35 Stability (K km-1)
Atmospheric Stability at high latitude region(Below the cloud layer 42-47 km) 60 55 50 Altitude (km) 45 40 20 -10 -5 45 40 0 5 10 15 25 30 35 Stability (K km-1)
Atmospheric Stability at low and middle latitude region(Below the cloud layer 42-47 km) 60 55 50 Altitude (km) 45 40 20 -10 -5 45 40 0 5 10 15 25 30 35 Stability (K km-1)