Download
1 / 30
310 likes | 345 Views
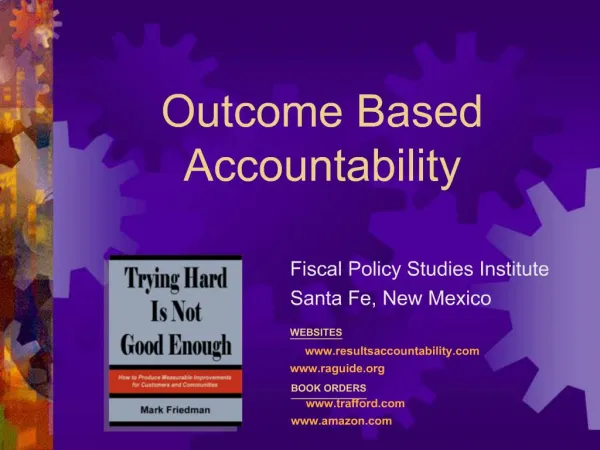
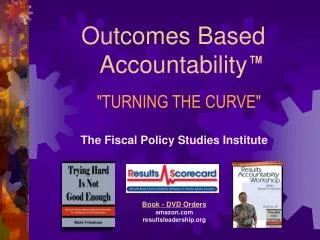
Outcome Based Accountability. ‘From Talk to Action’ David Burnby www.davidburnby.co.uk. Fiscal Policy Studies Institute Santé Fe, New Mexico www.resultsbasedaccountabilty.com www.raguide.org www.resultsleadership.org (publications). Outcome Based Accountability. 1 Language

E N D
Outcome Based Accountability ‘From Talk to Action’ David Burnby www.davidburnby.co.uk
Fiscal Policy Studies Institute Santé Fe, New Mexico www.resultsbasedaccountabilty.com www.raguide.org www.resultsleadership.org (publications)
Outcome Based Accountability 1 Language 2 Levels of Accountability 7 Steps from Talk to Action
Two Levels of Accountability Population Accountability about the well-being of WHOLE POPULATIONS for neighbourhoods – districts – regions - countries Performance Accountability About the well-being of CLIENT POPULATIONS for projects – agencies – service providers
1 Language Population Accountability ENDS Performance Accountability MEANS • Outcome • A condition of well-being for children, adults, families or communities • Indicator • A measure which helps quantify the achievement of an outcome • Performance Measure • A measure to evaluate how well a programme, agency or service system is working
Population and Performance Accountability OUTCOME: All Young People in (a place) are Healthy INDICATOR Obesity Rate End Contribution All Young People in (a place) WHOLE POPULATION Young people attending active lifestyle programme PERFORMANCE MEASURE % Young people attending losing weight Means
Seven Steps from Talk to Action:The Leaking Roof Not OK Experience Measure Forecast Inches of Water Fixed? Time Story behind the baseline (causes) Partners What Works? Action Plan (Strategy)
“Healthy and Successful Adults” OUTCOME • All age, all cause mortality rate • 16+ current smoking rate • Healthy life expectancy at Age 65 Measures of the outcome INDICATORS • Where we’ve been • Where we’re going • Where we want to be BASELINES Data Development Agenda (Pt 1) • The causes, the forces at work • What’s driving the baselines? STORY Behind the baselines • Public, Private and Voluntary Sector • Community groups • Residents PARTNERS With a role to play • What would it take to turn the curve? • Best practice • Best hunches WHAT WORKS Data Development Agenda (Pt 2) ACTION PLAN • What we propose to do, how and by when
The 7 Population Accountability Questions What are the quality of life conditions we want for the children, adults and families who live in our community? What would these conditions look like if we could see them? How can we measure these conditions? How are we doing on the most important of these measures? Who are the partners that have a role to play in doing better? What works to do better, including no cost/low cost ideas? What do we propose to do?
Whole Population Turning The Curve Report The definition of the WHOLE POPULATION we want to impact on (e.g. “All young people in Hull” or “All older people in Middlesbrough” etc.) The desired OUTCOME: The condition of well-being we want for our defined whole population The priority INDICATOR we will use to determine progress towards our OUTCOME The INDICATOR BASELINE made up of the historical data, the projected forecast (if nothing is done) and showing the curve we want to turn The STORY BEHIND THE BASELINE: What we know about the factors driving the baseline. What are the causes/factors at work? What’s our best community intelligence on this issue? Key pointers to action What are the gaps in our knowledge (our DATA DEVELOPMENT AGENDA)? What do we need to know to inform our action plan? Who are the KEY PARTNERS with a role to play in Turning the Curve? These could be public sector service providers, residents, voluntary and community organisations and businesses amongst others WHAT WOULD IT TAKE TO TURN THE CURVE? What’s our best thinking on this, our best hunches? What would work in our community? Always include at least one “No Cost/Low Cost” idea and an “Off The Wall” idea (to generate creative thinking) NB: ONE SIDE OF FLIPCHART PAPER ONLY!
Outcome Based Accountability Managing and Improving Performance
Programme Performance Measures QUANTITY QUALITY How much service did we deliver? How well did we deliver it? EFFORT Cause INPUT How much change/effect did we produce? What quality of change/effect did we produce? EFFECT OUTPUT Effect
Drug Treatment Programme QUANTITY QUALITY How well did we do it? How much did we do? • % clients completing programme • % counsellors trained to professional standard • % clients saying they were treated well • Number of clients enrolled • Number of courses • Number of counselling sessions EFFORT Is anyone better off? • Number clients drug free • At exit of programme • After 12 months • Number clients saying they were helped with their problems • Percentage clients drug free • At exit of programme • After 12 months • Percentage clients saying they were helped with their problems EFFECT
Not All Performance Measures Are Created Equal... QUANTITY QUALITY How well did we do it? How much did we do? LEAST important Also Very Important EFFORT Is anyone better off? MOST important EFFECT
The Matter of Control QUALITY QUANTITY How well did we do it? How much did we do? MOST control EFFORT Is anyone better off? LESS control EFFECT PARTNERSHIPS We have the least control over the most important matters
Performance Turning The Curve Report The programme, service system or project being performance managed The customers: i.e. the people whose lives are affected (for better or worse) by the actions of the programme The priority PERFORMANCE MEASURE derived in particular from the “How well” and “Better Off” (right hand quadrant) questions The PERFORMANCE MEASURE BASELINE made up of the historical data, the projected forecast (if nothing is done) and showing the curve we want to turn The STORY BEHIND THE BASELINE: What we know about the factors driving the baseline. What are the causes/factors at work? What is our understanding of what’s driving our performance? What are the gaps in our knowledge (our DATA DEVELOPMENT AGENDA)? What do we need to know to inform our action plan? Who are the KEY PARTNERS with a role to play in Turning the Curve? These could be internal departments, service users, suppliers etc. WHAT WOULD IT TAKE TO TURN THE CURVE? What’s our best thinking on this, our best hunches? What would work in our organisation? Always include at least one “No Cost/Low Cost” idea and an “Off The Wall” idea (to generate creative thinking)
Outcome Based Accountability Next Generation Commissioning
Outcome Based CommissioningHome Care Service How much did we do? How well did we do it? Service Specification (Home Care Service) • No. visits per week • Average length of visit • % service users who say service is reliable, flexible, respectful, friendly • The WHOLE POPULATION OUTCOME we’re looking to contribute to: “Increased Choice and Control” • The INDICATOR we’re trying to influence (the CURVE we want to turn): Support to live independently (NI 139) • (Story behind the baseline) • Description of the service including the QUANTITY of service we want to buy • We will measure the QUALITY of the service by these performance measures • We will work together to maximise the EFFECT of the service demonstrated by these performance measures (Customer Outcomes) Number of persons served Is anyone better off? • Percentage service users reporting that service has enabled them to remain at home • Number service users reporting that service has enabled them to remain at home 1. You can purchase services. 2. You can purchase service quality 3. You cannot purchase customer outcomes. Instead, you can purchase a contract relationship that maximizes good customer outcomes.
1. Traditional purchasing methods work fine in the upper quadrants. 2. They break down inthe Is anyone better off?quadrants (because of case mix differences and perverse incentives). WHICH MEANS 3.What we purchase in the lower quadrants are not deliverables, but rathera RELATIONSHIPwhere commissioner and service providers work together to maximize customer/client outcomes. Next Generation Commissioning Quantity Quality Effort BUT Effect
The Three Essential Provisionsof Next Generation Commissioning The three to five measures that say most about the effectiveness of the service provider’s performance* *As determined from the Five Step Method The most important performance measures
The Three Essential Provisionsof Next Generation Commissioning • Using Turning the Curve report cards based on the 7 performance accountability questions • Using the same basis for management supervision across the organisation Continuous Improvement Process
The Three Essential Provisionsof Next Generation Commissioning • Performance Partnership between commissioner and service provider • Periodic meetings to review progress on the three to five most importance performance measures (based on Turning the Curve reports) • Reviewing changing stories behind the baseline • Agreeing measures the commissioner can take to help improve performance as partners in facilitating improvement • e.g. Technical assistance and support • Brokering relationships with third parties • Helping to break down barriers to progress • This does not compromise respective accountability: • For commissioner’s responsibility for service provider’s performance and effective use of funds • For service provider’s commitment to continuous improvement process
Home Care Service QUANTITY QUALITY How well did we do it? How much did we do? • Number of visits per week • Average length of visit • % clients saying they were treated with dignity and respect • Number of persons served • Number of home visits • Number of shopping trips EFFORT Is anyone better off? • Number clients saying that service has enabled them to stay in their own home • Number of clients saying they feel happy and comfortable in their own home • % clients saying that service has enabled them to stay in their own home • % of clients saying they feel happy and comfortable in their own home EFFECT
Car Manufacture QUANTITY QUALITY How well did we do it? How much did we do? • Residual value of cars • Warranty claims • Unit cost • Customer satisfaction • Number of units produced • Tons of steel deployed EFFORT Is anyone better off? • £ Profit Margin • £ Share price • £ Return on Capital • % Profit margin • % Share price growth • % Return of Capital EFFECT
Private Sector Home Care Service QUANTITY QUALITY How well did we do it? How much did we do? • Number of visits per week • Average length of visit • % clients saying they were treated with dignity and respect • Number of persons served • Number of home visits • Number of shopping trips EFFORT Is anyone better off? • Number clients saying that service has enabled them to stay in their own home • Number of clients saying they feel happy and comfortable in their own home • % clients saying that service has enabled them to stay in their own home • % of clients saying they feel happy and comfortable in their own home EFFECT
Private Sector Home Care Service QUANTITY QUALITY How well did we do it? How much did we do? • Number of visits per week • Average length of visit • % clients saying they were treated with dignity and respect • Number of persons served • Number of home visits • Number of shopping trips EFFORT Is anyone better off? • Number clients saying that service has enabled them to stay in their own home • Number of clients saying they feel happy and comfortable in their own home • % clients saying that service has enabled them to stay in their own home • % of clients saying they feel happy and comfortable in their own home EFFECT
Private Sector Home Care Service QUANTITY QUALITY How well did we do it? How much did we do? • Number of visits per week • Average length of visit • % clients saying they were treated with dignity and respect • Number of persons served • Number of home visits • Number of shopping trips EFFORT • Number clients saying that service has enabled them to stay in their own home • Number of clients saying they feel happy and comfortable in their own home • % clients saying that service has enabled them to stay in their own home • % of clients saying they feel happy and comfortable in their own home Is anyone better off? • £ Profit Margin • £ Share price • £ Return on Capital • % Profit margin • % Share price growth • % Return of Capital EFFECT
Private Sector Home Care Service QUANTITY QUALITY How well did we do it? How much did we do? • Number of visits per week • Average length of visit • % clients saying they were treated with dignity and respect • % clients saying that service has enabled them to stay in their own home • % of clients saying they feel happy and comfortable in their own home • Number of persons served • Number of home visits • Number of shopping trips EFFORT • Number clients saying that service has enabled them to stay in their own home • Number of clients saying they feel happy and comfortable in their own home Is anyone better off? • £ Profit Margin • £ Share price • £ Return on Capital • % Profit margin • % Share price growth • % Return of Capital EFFECT
The OBA Journey – From Talk to Action ENDS (POPULATION ACCOUNTABILITY) Drawing the BASELINE (and the CURVE TO TURN) DESIRED OUTCOME The STORY BEHIND THE BASELINE Choosing the INDICATORS Choosing the PARTNERS REVIEW The ACTION PLAN Deciding WHAT WORKS Contributory Relationship PROCUREMENT MEANS (PERFORMANCE ACCOUNTABILITY) PERFORMANCE MEASURES How Much? How Well? Better Off? (CLIENT OUTCOMES)