Download
1 / 24
250 likes | 349 Views
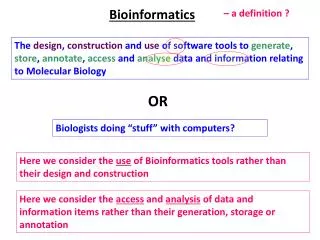
Statistical Bioinformatics. QTL mapping Analysis of DNA sequence alignments Postgenomic data integration Systems biology. Statistical Bioinformatics. QTL mapping Analysis of DNA sequence alignments Postgenomic data integration Systems biology. Mixed models for QTL by environment analysis.

E N D
Statistical Bioinformatics • QTL mapping • Analysis of DNA sequence alignments • Postgenomic data integration • Systems biology
Statistical Bioinformatics • QTL mapping • Analysis of DNA sequence alignments • Postgenomic data integration • Systems biology
Mixed models for QTL by environment analysis Mixed models represent correlations over sites and models differences in environmental variance: allows tests for QTL by environment interactions Eg marker Rub2a1 on LG3 shows a consistent effect raspberry total anthocyanins over 7 environments
Genetical genomics: QTL eQTL Jansen& Nap
eQTL analysis using pairs of barley DHs on a two-colour microarray A distant pair design gives more informative pairs than a random design (horizontal line) Significant (p < .001) QTLs were detected for 9557 out of 15208 genes Most significant QTL for rust resistance mapped to 2H: 23 genes with highly correlated expression also mapped to the same region
Taking QTL analysis further Analysis of more complex populations – moving from a single biparental cross through multiple related crosses to general association mapping populations. Analysis of high-dimensional phenotypic trait data (expression data, metabolomic data etc), including network-based approaches QTL analysis of processes (raspberry ripening, water use? Process of biofuel production?) Linkage analysis: review statistical methods, especially clustering, behind some marker technologies. Analysis of blackcurrant (454 sequencing) and sugarcane (Dart) show that more information can be obtained by working directly on continuous underlying data (intensities).
Statistical Bioinformatics • QTL mapping • Analysis of DNA sequence alignments • Postgenomic data integration • Systems biology
Molecular Sequence Analysis • Intragenic recombination detection - method Various methods developed at BioSS (DSS, PDM,HMM) • TOPALi - software User-friendly access to statistical phylogenetic methods • Molecular sequence alignment - analysis automation Phylogenetic tree/ model selection selection • Positive (diversifying) selection - methods appliedUse of state-of-the-art methodology for detection of functionally significant amino acid sites in proteins. • Comparative genomics analysis – growth area Phylogenetic tree estimation using many loci • Population genetic structure analysis – growth area • Optimal use of Next Generation Sequence data development
Statistical Bioinformatics • QTL mapping • Analysis of DNA sequence alignments • Postgenomic data integration • Systems biology
Example: Human nutrigenomics study 10 volunteers observed over 10 time points Various body fluids (blood, urine,saliva) collected Samples analyzed by various ‘omics’ techniques
Co-inertia analysis from metabolomic profiles of two samples: urine and plasma
Statistical Bioinformatics • QTL mapping • Analysis of DNA sequence alignments • Postgenomic • Systems biology
Can we learn the signalling pathway from data? Receptor molecules Cell membrane Activation Interaction in signalling pathway Phosphorylated protein Inhibition From Sachs et al Science 2005
Mechanistic models versus machine learning Bayesian network Differential equation model
Circadian rhythms in Arabidopsis thaliana Collaboration with the Institute of Molecular Plant Sciences at Edinburgh University (Andrew Millar’s group)
Focus on: 9 circadian genes: LHY, CCA1, TOC1, ELF4,ELF3, GI, PRR9, PRR5, and PRR3 Two gene expression time series measured with Affymetrix arrrays under constant light condition at 13 time points: 0h, 2h,…, 24h, 26h Plants entrained to different light:dark cycles 10h:10h (T20) and 14h:14h (T28) T28 T20
Cogs of the Plant Clockwork Morning genes Evening genes
Circadian genes in Arabidopsis thaliana, network learned from two time series over 13 time points ELF3 CCA1 LHY PRR9 GI TOC1 PRR5 PRR3 ELF4 “False negatives” “False positives”
Overview of the plant clock model PRR9/ PRR7 Y (GI) Evening Morning LHY/ CCA1 TOC1 Locke et al. Mol. Syst. Biol. 2006 X Sensitivity = TP/[TP+FN] = 62% Specificity = TN/[TN+FP] = 81%
Overview of the plant clock model PRR9/ PRR7 Y (GI) Yes Yes Evening Morning Yes LHY/ CCA1 TOC1 Yes Locke et al. Mol. Syst. Biol. 2006 X Correct sign Sensitivity = TP/[TP+FN] = 62% Specificity = TN/[TN+FP] = 81%
Future work • Integration of mechanistic and machine learning models • Latent variable models for post-translational modifications • Network inferences from eQTL type data • Allowing for heterogeneity and non-stationarity
Can we learn the protein signalling pathway from protein concentrations? Flow cytometry data from 100 cells Raf pathway Sachs et al., Science 2005
Predicted network 11 nodes, 20 edges, 90 non-edges 20 top-scoring edges: 15/20 correct 5/90 false 75% 94%