Download
1 / 35
350 likes | 775 Views
Statistical Bioinformatics Genetic association Genomics Transcriptomics Proteomics Regulatory networks Statistical Bioinformatics Genetic association Genomics Transcriptomics Proteomics Regulatory networks QTL analysis and association mapping in plants Diploid inbreeders eg barley

E N D
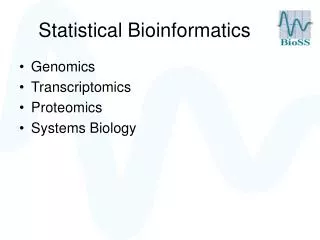
Statistical Bioinformatics • Genetic association • Genomics • Transcriptomics • Proteomics • Regulatory networks
Statistical Bioinformatics • Genetic association • Genomics • Transcriptomics • Proteomics • Regulatory networks
QTL analysis and association mapping in plants • Diploid inbreeders eg barley • Diploid outbreeders eg raspberry, blackcurrant • Tetraploid outbreeders eg potato • Each requires a different approach • Christine Hackett
Autotetraploid species • Linkage analysis and QTL mapping methods implemented in TetraploidMap software, applied to Stirling x 12601ab1 cross • Future extension – how to use SNP markers with dosage information? • Methods applicable to other crops eg blueberry?
Association mapping– how to model population structure? Cluster analysis based on marker data. First two principal coordinates obtained from the genetic association matrix Simulation study in progress to compare • No population structure • Admixture populations Population structure in barley genotypes
Statistical Bioinformatics • Genetic association • Genomics • Transcriptomics • Proteomics • Regulatory networks
Phylogeneticanalysis Mitochondrial DNA of 5 strains of the potato cyst nematodeGlobodera pallida
Past forces shaping MSAs • Divergence of sequences by speciation and nucleotide substitution (phylogenetics). • Horizontal gene transfer (recombination), especially in bacteria and viruses.
TOPALi Recombination detection FrankWright,Iain Milne & Dirk Husmeier
Past forces shaping MSAs • Divergence of sequences by speciation and nucleotide substitution (phylogenetics). • Horizontal gene transfer (recombination), especially in bacteria and viruses. • Selective pressure acting on functional domains.
TOPALi Future plans • Detect genomic regions under selective pressure functional domains in proteins • Methodology development: combined prediction of breakpoints due to recombination and evolutionary rate change. • Improved phylogenetic analysis • Investigate use of UK GRID computationalresources for faster analyses
Statistical Bioinformatics • Genetic association • Genomics • Transcriptomics • Proteomics • Regulatory networks
Genes differently expressed between two conditions • Agilent Eca (Erwinia carotovora atroseptica) arrays • Tuber samples after 12 h of infection for mutant and wildtype Pba strains • Plot of log-fold change vs. average log intensity. • Points far away from the horizontal line seem “differentially expressed”. • Which are significant?
Genes differently expressed between two conditions • Agilent Eca (Erwinia carotovora atroseptica) arrays • Tuber samples after 12 h of infection for mutant and wildtype Eca strains • Plot of log-fold change vs. average log intensity. • Points far away from the horizontal line seem “differentially expressed”. • Which are significant?
Statistical Methods (Limma, SAM) help to detect significant genes • BUT: Many methods assume that the variances in both groups are the same • If this is not the case: • Algorithms might give wrong answers • The definition of “differential expression” becomes more difficult
Claus Mayer (BioSS) • More complex statistical tests for detecting differential gene expression. • Situations where standard assumptions are violated. • Allows for different variance-covariance structures in both populations.
Statistical Bioinformatics • Genetic association • Genomics • Transcriptomics • Proteomics • Regulatory networks
Chris Glasbey: Nonlinear Warping John Gustafsson, Chalmers University, Sweden WARP
2-D Gel Comparison Two gels superimposed (in different colours)
Proteomics:2-DGel Interpretation • Graham Horgan • Identify spots which differbetweentreatmentsusing variance and covariance information from other spots differently expressed proteins
Statistical Bioinformatics • Genetic association • Genomics • Transcriptomics • Proteomics • Regulatory networks
Detect active pathways in a “known” network • Network of protein-protein and protein-DNA interactions “known” from the literature • Gene expression profiling for different conditions • Example: wildtype versus mutant strain • Can we identify different pathways associated with these conditions? • We need a robust method • Expression data: noisy, missing values • Post-translational modifications
Cytokine Network • Collaboration with SCGTI • Interferon Pathway • Cytokines • Pivotal role in modulating the innate and adaptive mammalian immune system • Network of protein-protein and protein-DNA interactions from the literature • Two gene expression times series from bone marrow-derived macrophages in mice • Infected with cytomegalovirus • Infected and treated with IFN-gamma
Reverse Engineering of Regulatory Networks Can we learn the network structure from postgenomic data themselves?
Evaluation: Raf signalling pathway • Cellular signalling network of 11 phosphorylated proteins and phospholipids in human immune systems cell • Laboratory data from cytometry experiments • Down-sampled to 100 measurements • Sample size indicative of microarray experiments • Two types of experiments: • Passive observations • Active interventions (gene knockouts) • Literature: “gold-standard” network
Modelling transcriptional regulation with variational Bayesian factor analysis