Download
1 / 1
20 likes | 172 Views
ENHANCED DETECTION OF PARAMAGNETIC CONTRAST AGENTS IN MAGNETIC RESONANCE IMAGES VIA PHASE IMAGE CROSS-CORRELATION ANALYSIS. Parker H. Mills, Eric T. Ahrens Department of Biological Sciences and the Pittsburgh NMR Center for Biomedical Research, Carnegie Mellon University, Pittsburgh, PA.

E N D
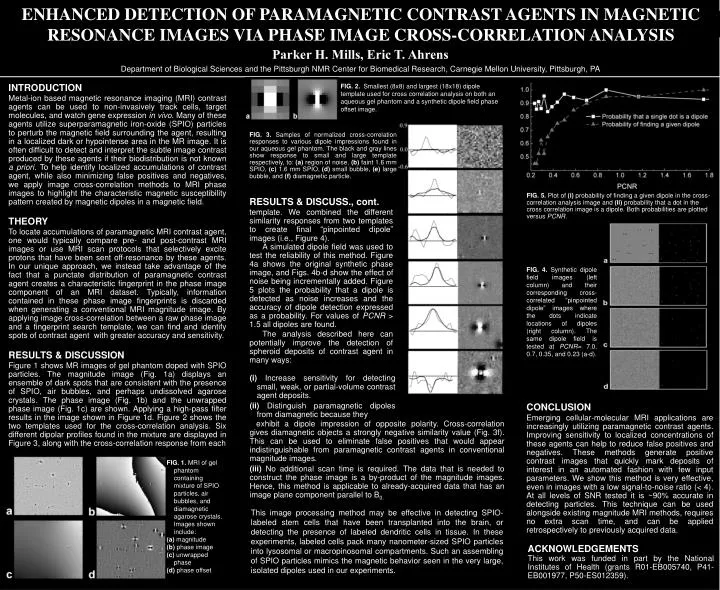
ENHANCED DETECTION OF PARAMAGNETIC CONTRAST AGENTS IN MAGNETIC RESONANCE IMAGES VIA PHASE IMAGE CROSS-CORRELATION ANALYSIS Parker H. Mills, Eric T. Ahrens Department of Biological Sciences and the Pittsburgh NMR Center for Biomedical Research, Carnegie Mellon University, Pittsburgh, PA INTRODUCTION Metal-ion based magnetic resonance imaging (MRI) contrast agents can be used to non-invasively track cells, target molecules, and watch gene expression in vivo. Many of these agents utilize superparamagnetic iron-oxide (SPIO) particles to perturb the magnetic field surrounding the agent, resulting in a localized dark or hypointense area in the MR image. It is often difficult to detect and interpret the subtle image contrast produced by these agents if their biodistribution is not known a priori. To help identify localized accumulations of contrast agent, while also minimizing false positives and negatives, we apply image cross-correlation methods to MRI phase images to highlight the characteristic magnetic susceptibility pattern created by magnetic dipoles in a magnetic field. FIG. 2. Smallest (8x8) and largest (18x18) dipole template used for cross correlation analysis on both an aqueous gel phantom and a synthetic dipole field phase offset image. FIG. 3. Samples of normalized cross-correlation responses to various dipole impressions found in our aqueous gel phantom. The black and gray lines show response to small and large template respectively, to: (a) region of noise, (b) faint 1.6 mm SPIO, (c) 1.6 mm SPIO, (d) small bubble, (e) large bubble, and (f) diamagnetic particle. FIG. 5. Plot of (i) probability of finding a given dipole in the cross-correlation analysis image and (ii) probability that a dot in the cross correlation image is a dipole. Both probabilities are plotted versus PCNR. RESULTS & DISCUSS., cont. template. We combined the different similarity responses from two templates to create final “pinpointed dipole” images (i.e., Figure 4). A simulated dipole field was used to test the reliability of this method. Figure 4a shows the original synthetic phase image, and Figs. 4b-d show the effect of noise being incrementally added. Figure 5 plots the probability that a dipole is detected as noise increases and the accuracy of dipole detection expressed as a probability. For values of PCNR > 1.5 all dipoles are found. The analysis described here can potentially improve the detection of spheroid deposits of contrast agent in many ways: THEORY To locate accumulations of paramagnetic MRI contrast agent, one would typically compare pre- and post-contrast MRI images or use MRI scan protocols that selectively excite protons that have been sent off-resonance by these agents. In our unique approach, we instead take advantage of the fact that a punctate distribution of paramagnetic contrast agent creates a characteristic fingerprint in the phase image component of an MRI dataset. Typically, information contained in these phase image fingerprints is discarded when generating a conventional MRI magnitude image. By applying image cross-correlation between a raw phase image and a fingerprint search template, we can find and identify spots of contrast agent with greater accuracy and sensitivity. FIG. 4. Synthetic dipole field images (left column) and their corresponding cross-correlated “pinpointed dipole” images where the dots indicate locations of dipoles (right column). The same dipole field is tested at PCNR= 7.0, 0.7, 0.35, and 0.23 (a-d). RESULTS & DISCUSSION Figure 1 shows MR images of gel phantom doped with SPIO particles. The magnitude image (Fig. 1a) displays an ensemble of dark spots that are consistent with the presence of SPIO, air bubbles, and perhaps undissolved agarose crystals. The phase image (Fig. 1b) and the unwrapped phase image (Fig. 1c) are shown. Applying a high-pass filter results in the image shown in Figure 1d. Figure 2 shows the two templates used for the cross-correlation analysis. Six different dipolar profiles found in the mixture are displayed in Figure 3, along with the cross-correlation response from each (i) Increase sensitivity for detecting small, weak, or partial-volume contrast agent deposits. (ii) Distinguish paramagnetic dipoles from diamagnetic because they CONCLUSION Emerging cellular-molecular MRI applications are increasingly utilizing paramagnetic contrast agents. Improving sensitivity to localized concentrations of these agents can help to reduce false positives and negatives. These methods generate positive contrast images that quickly mark deposits of interest in an automated fashion with few input parameters. We show this method is very effective, even in images with a low signal-to-noise ratio (< 4). At all levels of SNR tested it is ~90% accurate in detecting particles. This technique can be used alongside existing magnitude MRI methods, requires no extra scan time, and can be applied retrospectively to previously acquired data. exhibit a dipole impression of opposite polarity. Cross-correlation gives diamagnetic objects a strongly negative similarity value (Fig. 3f). This can be used to eliminate false positives that would appear indistinguishable from paramagnetic contrast agents in conventional magnitude images. (iii) No additional scan time is required. The data that is needed to construct the phase image is a by-product of the magnitude images. Hence, this method is applicable to already-acquired data that has an image plane component parallel to B0. FIG. 1. MRI of gel phantom containing mixture of SPIO particles, air bubbles, and diamagnetic agarose crystals. Images shown include: (a) magnitude (b) phase image (c) unwrapped phase (d) phase offset This image processing method may be effective in detecting SPIO-labeled stem cells that have been transplanted into the brain, or detecting the presence of labeled dendritic cells in tissue. In these experiments, labeled cells pack many nanometer-sized SPIO particles into lysosomal or macropinosomal compartments. Such an assembling of SPIO particles mimics the magnetic behavior seen in the very large, isolated dipoles used in our experiments. ACKNOWLEDGEMENTS This work was funded in part by the National Institutes of Health (grants R01-EB005740, P41-EB001977, P50-ES012359).