Download
1 / 14
140 likes | 239 Views
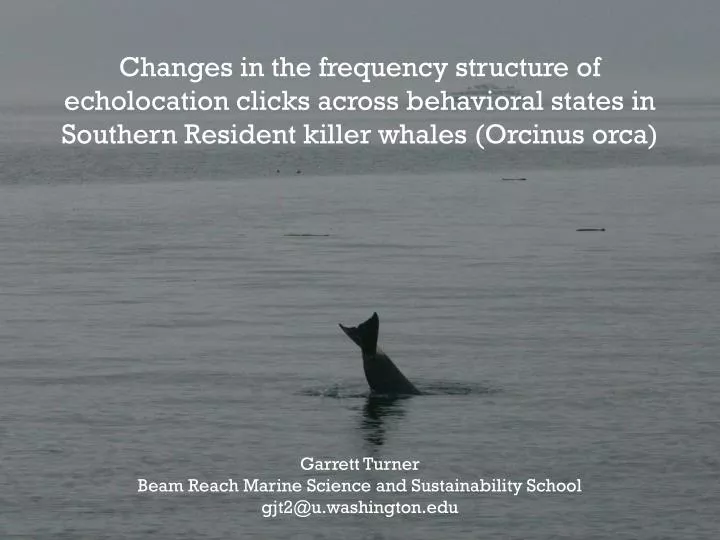
Changes in the frequency structure of echolocation clicks across behavioral states in Southern Resident killer whales ( Orcinus orca) Garrett Turner Beam Reach Marine Science and Sustainability School gjt2@u.washington.edu. Background Information:.

E N D
Changes in the frequency structure of echolocation clicks across behavioral states in Southern Resident killer whales (Orcinus orca) Garrett Turner Beam Reach Marine Science and Sustainability School gjt2@u.washington.edu
Background Information: Killer whales are known to produce echolocation clicks during various behavior states, and it is assumed that they were used primarily for hunting salmon and navigation. • Behavior states: • Foraging • Traveling • Milling • Socializing • Resting • Type of Clicks: • Single clicks • Click trains
Hypothesis: I predicted variations would be found in the frequency structures of echolocation clicks across different behavior states.
Differences in Hearing Sensitivities • Whales can here frequencies higher than 100 kHz • Humans can only hear up to 20 kHz Hearing Sensitivity for Humans Hearing Sensitivity for Killer Whales
Data Collection: Recording Clicks: • We had five hydrophones deployed • I only used recordings from the CRT hydrophone. • The CRT is more sensitive to higher frequencies which is very important when you are looking at echolocation clicks. Behavioral data was collected with respect to the five defined behavior states On Axis Clicks: Clicks that are off axis become distorted, and in order to control for this observational data was collected on the orientation of the whales with respect to the boat.
Examples of Click Spectra and Wave Forms 400 µ Seconds 286 µ Seconds
Click Measurements Center frequency: Is the frequency value that splits the energy from the spectrum into two equal parts RMS Bandwidth: The RMS bandwidth is used to describe the spectral standard deviation around the center frequency of the spectrum Q-Value: Q-values are used to describe the overall frequency structure of clicks with respect the center frequency and the RMS bandwidth. Q-value = Center Frequency / RMS Bandwidth High Q-values: Correspond with a sharp and narrow spectrum Low Q-values: Correspond with a broad and wide spectrum
Results: Significant: Foraging vs. Milling and Traveling vs. Milling Significant: Foraging vs. Milling
Results: Q-values for all three behaviors were significantly different from each other
Discussion: • This study shows killer whales are able to actively control the frequency of their clicks for specific tasks and situations, this has may have important implications including: • Ability to avoid masking due to ambient noise? • Could be used as an empirical measurement of behavior states • Social meaning • Functional differences It is still unknown what the whales are doing under water, and the different structures suggest the clicks are being used for specific tasks during various behavior states
Future Studies: More behavioral data should be collected in order to strengthen the results of this study. Ambient noiseis also a continuing problem for the SRKW, and more information is needed for how well killer whales can avoid masking. Further click frequency studies should also compare click structures across individual whales, pods, ecotypes, and males vs. females
Possible Sources of Error: Analyzing the data by hand for on axis clicks Due to the high amplitudes of clicks many of the phonations were clipped which limited my sample size Human error while classifying the behavioral state. Possible equipment limitations (sensitivity of the hydrophone)
Acknowledgements: • I would like to thank Jason Wood, Val Veirs, and Scott Veirs for supporting our program and research over the last 10 weeks. • Thank you to everyone that provided information on the location of the whales. • Thank you to Vanessa, Dave, Cat, Megan, and Hana for an amazing program. • Thank you to Todd Shuster for giving us the opportunity to study and learn aboard the Gato Verde.