Download
1 / 31
310 likes | 423 Views
The Mechanics of Filter Cake Formation on a Geotextile. J. Richard Weggel, Ph.D., P.E. Professor Emeritus, Drexel University Nicholas D. Ward, D.Phil., C.P.Eng. Otago Computational Modeling Group, Ltd. Problem. Accumulation of sediment on a geotextile filter due to two processes:

E N D
The Mechanics of Filter Cake Formation on a Geotextile J. Richard Weggel, Ph.D., P.E. Professor Emeritus, Drexel University Nicholas D. Ward, D.Phil., C.P.Eng. Otago Computational Modeling Group, Ltd.
Problem • Accumulation of sediment on a geotextile filter due to two processes: • Advection – particles suspended in the fluid (usually a slurry) are carried downward by outflow through the geotextile • Particle Settling - rate depends on the settling velocity – a function of particle size, shape and density, and fluid viscosity
Variables Ψ = geotextile permittivity – constant K = permeability of filter cake - constant y = height of slurry surface above geotextile z = thickness of accumulating filter cake h = distance from top of accumulating filter cake to slurry surface dz = increase in thickness of accumulating filter cake Note that h decreases with time due to both the decline of slurry surface and to the increase in filter cake thickness.
Assumptions • Permeability of accumulating sediments remains constant • Change in flow rate is due to increased thickness of accumulating filter cake not to any significant change in permeability • Initially the sediment is uniformly distributed through the fluid
Permeability of Geotextile and Filter Cake The permeability perpendicular to the layers of a two-layer system, each having different permeabilities is given by: in which Ksystem = the permeability of the two layer system z1 = the thickness of layer 1 z2 = the thickness of layer 2 K1 = the permeability of layer 1, and K2 = the permeability of layer 2.
Permeability of Geotextile and Filter Cake • Since the geotextile’s thickness is relatively small, the combined permeability of the geotextile and filter cake can be expressed by: in which Ksystem = the permeability of the filter cake/geotextile system z = the thickness of the filter cake, K = the permeability of the filter cake, and Ψ = the permittivity of the geotextile.
Darcy’s Equation for Geotextile/Filter Cake System in which q = the flow rate through the geotextile/filter cake system per unit area , and h = the head.
Filter Cake Accumulation Model • A numerical model using an Excel spreadsheet was developed and tested against experimental data • The model is solved using an explicit finite-difference scheme that steps through time to predict the thickness of the accumulating filter cake, the rate of flow through the system, the cumulative flow and the sediment size distribution at various layers of the filter cake.
Filter Cake Accumulation Model (cont.) We initially consider only the accumulation due to advection and subsequently derive the accumulation due to particle settling. The initial flow at time t = 0 is given by: In which q0 = the flow at the start, h0 = the initial head, z0 = the initial thickness of the filter cake on the geotextile, y0 = the initial height of the slurry surface above the geotextile
Filter Cake Accumulation Model (cont.) The initial cumulative flow through the system is: The initial slurry level is y0 and the water level one time step, Dt, later is:
Filter Cake Accumulation Model (cont.) The rate of increase in filter cake thickness is give by: In which ai = the volumetric solids concentration of theith component of the slurry where the sediment has been characterized by a finite number of components, e = the solids fraction of the accumulated filter cake (1 – porosity), and vi = the settling velocity of the ith component. Note that the first term on the right hand side of the equation is the change in thickness due to the advective transport to the filter cake.
Filter Cake Accumulation Model (cont.) The finite difference equations are given by: (increase in filter cake thickness) (change in flow rate) where and where the subscript n – 1 indicates the value from the previous time step, Dt.
Filter Cake Accumulation Model (cont.) The cumulative discharge through the system is given by: After all of the sediment has settled out, the final thickness of the filter cake is:
Spreadsheet Program • Set up for 6 sediment components: • one suspended sediment (colloidal), and • 5 having settling velocity • Settling velocity approximated by Rubey (1933) equation, given by, in which g = acceleration of gravity, n = kinematic viscosity of the fluid, r = density of fluid, rs = density of sediment, and di = the diameter of the ith sediment component.
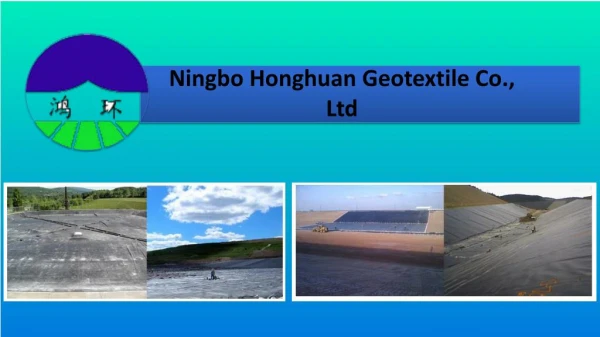
Experiments • Experiments conducted using a graduated settling tube with two different geotextiles selected because of their low permittivity and availability. • Experiments conducted with three sediments: Ottawa sand, fine quartz sand and Plasti-grit (a light weight, hard plastic used for sand blasting)
Geotextile Properties Table 1 Hydraulic Properties of Geotextiles (from manufacturer)
Sediment Characteristics Plasti-grit – settling characteristics most closely to those of sediments normally dewatered using geotextile tubes. Characterized by 5 size components (no colloidal material) Settling velocity selected for geometric mean of size.
Sediment Size Distribution at Various Layers Take difference between lines and normalize to yield size distribution at given layer.
Size Distribution – Plasti-grit z = 0.0870 m z = 0.055 m z = 0.000 m
Clear Water Interface • When the rate of decline of the slurry surface (dy/dt= q) decreases to less than the rate of settlement of the smallest sediment particles – a clear water interface occurs. • For a slurry with a colloidal component or with extremely small particles – a clear water interface will not occur. • For the Plasti-grit example: Smallest particle settling velocity v = 0.00381 m/s and the rate of decline of the slurry surface equals this value when y = 0.953 m and t = 37.0 s. 100 s later, when t = 137 s, the slurry surface has declined from 0.953 m to 0.708 m (0.245 m) and the smallest particle has settled 100 s x 0.00381 m/s = 0.381 m. Hence the height of the clear water interface is 0.953 – 0.245 = 0.708 m
Vacuum Filtration The model can be “tweaked” to consider the application of a vacuum on the downstream side of the system by “artificially” increasing the permeability of the sediment. The driving head is increased while the distance traveled by the sediment to the geotextile remains the same. or where K = the actual permeability, Kv = the “artificial” permeability, hv= the added head due to the vacuum, and h2 = hv + h = the total head.
Parametric Study of Vacuum Filtration (1 m vacuum yields Kv = 0.000152(1+1/1.25) = 0.000274 m/s)
Considering the Addition of Flocculants • The addition of flocculants can affect the sedimentation process in several ways: • they can increase the permeability of the accumulating sediment, • they can increase the rate of settling, • they can increase the porosity of the accumulating sediment (decrease the in-situ bulk density), and, consequently, • they increase the thickness of the accumulating sediments.
Effect of Flocculent on Dewatering Rate Increased porosity from 0.4 to 0.7; increased permeability from 0.000152 to 0.00152 m/s (one order of magnitude)
Questions are welcome. Thank you for your interest. Presented by: J. Richard Weggel, Ph.D., P.E. weggel@drexel.edu www.pages.drexel.edu/~weggel/