Download
1 / 23
230 likes | 307 Views
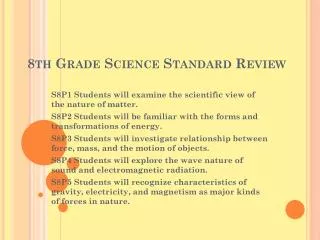
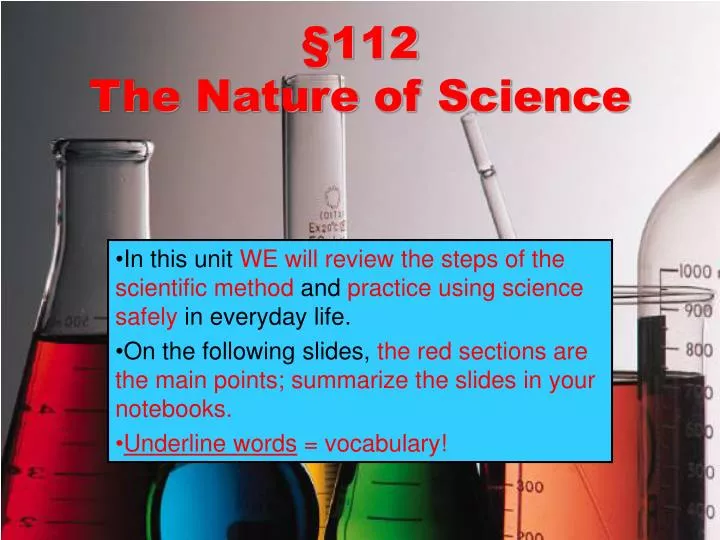
§112 The Nature of Science. In this unit WE will review the steps of the scientific method and practice using science safely in everyday life. On the following slides, the red sections are the main points; summarize the slides in your notebooks. Underline words = vocabulary!.

E N D
§112 The Nature of Science In this unit WE will review the steps of the scientific method and practice using science safely in everyday life. On the following slides, the red sections are the main points; summarize the slides in your notebooks. Underline words = vocabulary!
What is Science? • Science is the organized way of using evidence to learn about the natural world. • Defined by the National Academy of Sciences, it is the "use of evidence to construct testable explanations and predictions of natural phenomena, as well as the knowledge generated through this process." • The goals of science: • to investigate • to predict future events • to explain natural events http://icestories.exploratorium.edu/dispatches/wp-content/uploads/2008/06/img_0255.jpg
What is Biology? • Our science is biology; in Latin that means: bio- = life, -ology = study of • The goal of biology is the study of living organisms to understand their relationships with one another. http://images.publicradio.org/content/2008/03/21/20080321_moose6_33.jpg
Observing • Observing uses one or more of the five senses (sight, hearing, touch, smell, & taste) to gather information about events or processes. • Observing allows you and scientists to gather information about the subject they are investigating. Tiff Shao, a NYC native and biology major, is studying biodiversity in Costa Rica for Duke University’s Organization of Tropical Studies. Although Tiff is far from Duke, the classroom is not too far away.Link
Data, Inference, & Prediction • Through observing, scientists collect information, called data. • Scientists then use this data to make inferences. • An inference is a logical interpretation based on experience or prior knowledge. • A prediction is a statement or claim that a particular event will occur in the future (EX the weather). This image is view of the meteorological data collected for weather stations and used by forecasters to predict the weather. Link
Types of Data • Quantitative data are expressed in numbers(concrete terms); • EX the beaker held150 mL of water. • Qualitative datatend to be descriptive (subjective); • EX the plant is wiltedand looks like its dying. • What are some other examples of data? http://sageseeds.info/tutorials/unwilt.gif
Scientific Theories • A scientific theoryis based on natural and physical events and are well-established, highly-reliable explanations of these events. • Atomic Theory • Cell Theory • Theory of Evolution • Theories may change as new areas of scienceand new technologies are developed, providing new information. This powerful electron microscope allows researchers to see tiny microbes and cells as never before; the system includes a camera to record the data. Link
The Scientific Method • The scientific method is a series of steps that scientists use to answer a question: • Purpose/Problem • Hypothesis • Experiment • Data Collection • Analysis • Conclusion http://3.bp.blogspot.com/_AZ11xOAXRiY/RuXpxTqqRKI/AAAAAAAAAA0/GJxdM9EmHg8/s400/scientific+method.gif
Typically after making an observation a scientist will begin to question why? What do you want to learn or answer? You must research to find out what you already know about the problem and ask questions that still need to be answered. EX Cleaning up with paper towels; What is the best brand to save money and time? Step #1 – Purpose or Problem http://www.ecos.com/downloads/LargeColorjpg/9908_PaperTowels6PackLeft.jpg
A hypothesis is a possible explanation (answer) to a scientific question, often called an educated guess. A hypothesis must be testable and capable of being supported by observational evidence; the evidence typically comes from an experiment. EX Could you test these hypotheses? “If I clean using Viva paper towels, then I will save money and time.” “If I place a beaker of water in the sun, then it will evaporate faster than in the shade.” Step #2 – Hypothesis http://newyorkrenovator.com/2008/11/the-paper-towel-duel.html
Step #3 - Experiment • An experiment tests the hypothesis to see if it is correct. • Scientists use instruments that measure (scales, thermometers, stop watches, computers, etc) to gather the data. • Scientists also keep detailed notes on the experiment, or the procedures, so the experiment can be duplicated (or copied) in the future. • Lastly, scientists repeat the experiment through several trialsto get the most accurate data possible. http://newyorkrenovator.com/2008/11/the-paper-towel-duel.html
Step #4 – Data Collection • The information collected during an experiment is data. • This data could be qualitative (color, odor, or sound) or it could be quantitative (numbers). This image above provides qualitative data (Link) during an experiment while the image below provides quantitative data during an experiment (Link).
Step #5 - Analysis • Scientists determine how to represent that data, whether in charts, graphs, tables, etc. • They analyze(look closely at) their data and study the results. http://barbarabray.net/wp-content/uploads/2010/07/datacollection.jpg
Step #6 - Conclusion • At the conclusion of the experiment, the scientists ask, “What did I find out?” and discuss the results of their analysis. • A conclusion states whether or not the hypothesis was correct. • Often the data does not support the hypothesis, which means the whole process starts over again with new questions to be answered! http://itll.colorado.edu/images/uploads/courses_workshops/fypteams-pyramidweb.jpg
Designing Controlled Experiments • A controlled experiment is an experiment in which all factors except one remain constant (are the same). • These factors are called variables, or any factor that changes in an experiment. • Look at the experimental set-up shown to the right. Discuss with your neighbor and identify: • What is being changed in this set up? • What is the same throughout? http://www.green-planet-solar-energy.com/images/water-science-experiment.gif
Constants • In order for an experiment to test only one variable, each other part of the experiment has to be the same. • These are constants. • In the previous beaker example • the beaker size must be the same • the amount of water must be the same • The amount of food dye must be the same http://www.yaledailynews.com/img/2007/12/12/475f86e3f3a56_SCITECH.jpg
Independent (Manipulated) Variable • The variable the scientist changes is called the independent ( or manipulated) variable. • “I, the scientist” am changing = independent variable http://csam.montclair.edu/images/csam/weston_main.jpg
Dependent (Responding) Variable • The variable that is expected to change in response is the dependent (or responding) variable. • The “data I collect” = dependent variable; it is what we measure.
Vocabulary in Action! • Independent Variable = “I the scientist” am controlling the temperature of the water. • Dependent Variable = “data I collect”; Speed of diffusion of the food dye,how quickly does the color spread. Dependent Variable!!! http://www.green-planet-solar-energy.com/images/water-science-experiment.gif http://upload.wikimedia.org/wikipedia/commons/e/eb/Diffusion.gif Independent Variable!!!
Graphs • Remember scientists show their data in graphs. • Remember the acronym DRY MIX when graphing for science. • Dependent/Responding variable = Y axis. • Manipulated/Independent = X axis. • Sketch the graph to remember the axes. Dependent Variable!!! http://www.business-analysis-made-easy.com/image-files/xy-axis.gif Independent Variable!!!
What Type of Graph? http://www.jpowered.com/php-scripts/adv-graph-chart/images/graph-screen.gif • The type of graph you will use depends on the type of data in your experiment. • Line – use for infinite data (i.e. time) • Bar – static or finite data (i.e. number of days in a week) • Pie – good visual for %
Reading A Graph • Graphs allow us to interpret and predict by reading carefully. • How would you guess the volume of evaporation at day 7 in the sun?
Unit Conclusion • The steps of the scientific method will be used throughout the year during our class experiments. • Scientists study the world through experiments using very similar procedures and steps. • As scientists in this classroom, safety is the number one priority! http://www.calvin.edu/academic/science/summer/images/bioresearch2009-720px.jpg