Download
1 / 26
260 likes | 436 Views
Redevelopment Agency Policies: A slippery slope between gentrification & community development CASE STUDY of CENTRAL LONG BEACH PROJECT REDEVELOPMENT AREA. BACKGROUND : Study Area. POLICY QUESTION. Do Redevelopment Agency Policies facilitate the gentrification process?

E N D
Redevelopment Agency Policies: A slippery slope between gentrification & community developmentCASE STUDY of CENTRAL LONG BEACH PROJECT REDEVELOPMENT AREA
POLICY QUESTION Do Redevelopment Agency Policies facilitate the gentrification process? If so, what can community members and stakeholders do to mitigate the negative effects of ‘gentrification through redevelopment’?
LONG BEACH City Boundary Created by Maidel Luevano Sources: 2005 – 2009 American Community Survey, Census Bureau, ESRI, UCLA Mapshare
LONG BEACH Facts and Figures • 2nd largest city in Los Angeles County • Population – 461,522 • Total households – 163,088 • Median Income – $50,040 Sources: 2005 – 2009 American Community Survey, Census Bureau, City of Long Beach Website
LONG BEACH Demographics Created by Maidel Luevano Sources: 2005 – 2009 American Community Survey, Census Bureau, ESRI
LONG BEACH Race & Ethnicity Distribution Created by Maidel Luevano Sources: 2005 – 2009 American Community Survey, Census Bureau, ESRI, UCLA Mapshare
LONG BEACH Lowest Income Buffer Created by Maidel Luevano Sources: 2005 – 2009 American Community Survey, Census Bureau, ESRI, UCLA Mapshare
LONG BEACH Lowest Income Concentration Created by Maidel Luevano Sources: 2005 – 2009 American Community Survey, Census Bureau, ESRI, UCLA Mapshare
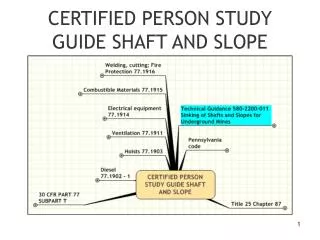
LONG BEACH “Highest Need Areas” Hot Spot Analysis Created by Maidel Luevano Sources: 2005 – 2009 American Community Survey, Census Bureau, ESRI, UCLA Mapshare
LB RDA Central Project Area Timeline 1992-Present Central Long Beach Project Redevelopment Area formally adopted Annual Report published highlighting major redevelopment projects September 1993 December 2009 April 1992 Los Angels Riots Structural damage to Central Long Beach area buildings totaled more than $19 million March 2001 Redevelopment Agency Board and City Council reapprove the adoption of the project area
LB RDA Central Project Area Blight Survey • Built Environment • Deterioration and Dilapidation to structures in 20% of all blocks within the Project Area • Defective Design and character of physical construction: illegal garage conversions, “bootlegged” additions, additions that reflect poor craftsmanship utilizing scrap material, with little regard to integration to original design • 50% of building stock built pre-1950 • Shifting Use indicating that private enterprise is either unwilling or unable to invest sufficient capital to construct or rehabilitate properties to meet modern space or market requirements • Incompatible Uses • Vacancies • Ownership Patterns: Many commercially zoned areas in the Project Area are made up of narrow or shallow lots, requiring the assembly of two or more lots to accommodate expansion or new development. Such lots are often under individual ownership, making private assembly difficult and time consuming. Higher density or updated development is unlikely without a major land assembly effort. • Social • Rapid Population Growth: managing increasing demand for public services and proper delivery of those services • Population is much younger on the whole than the City average, leading to problems with gangs, drugs and related criminal activity. Educational levels are also lower than City averages, indicating a trend toward a growing disparity between the educated and the under-educated • Lower Median Income in the Project Area is a significant blighting influence: residents have little disposable income to maintain or improve properties, it is common for more than one household to share a dwelling so it is affordable, low Project Area incomes makes business attraction challenging and new business survival tenuous • Inadequate Amount of Public Space • High Crime Rates: the perception of the Project Area as a dangerous place to live and work discourages in-migration of relatively affluent residents, new business owners and investors, and often makes favorable financing difficult to obtain • Economic • Impaired Investments: • negative taxable retail sales tax trends • low commercial building permit activity • high business turnover • low stability • high commercial vacancy rates • large number of vacant and underutilized lots • wholesale relocation of the new sales business out of the Project Area Source: Long Beach Redevelopment Agency 2004-2009 Five Year Implementation Plan
LB RDA Central Project Area Boundary & Expenses Overview Central Long Beach Redevelopment Project Area Created by Maidel Luevano Source: Long Beach Redevelopment Agency 2009 Annual Report Source: Long Beach Redevelopment Agency 2009 Annual Report
LB RDA Central Project Area Major Development Projects Central Long Beach Redevelopment Project Area Created by Maidel Luevano Source: Long Beach Redevelopment Agency Source: Long Beach Redevelopment Agency 2009 Annual Report
LB RDA Central Project Area Proposed Service Areas Central Long Beach Redevelopment Project Area Source: Long Beach Redevelopment Agency Created by Maidel Luevano
LB RDA Central Project Area Service Area Collaboration Opportunities Central Long Beach Redevelopment Project Area 1 mile 0.6 mile Source: Long Beach Redevelopment Agency Created by Maidel Luevano
RECOMMENDATIONS:Moving Beyond the Traditional Redevelopment Process
LB RDA Central Project Area Service Area Recommendations • Demand a more transparent, collaborative approach to the “blight removal” process between existing residents, stakeholders, RDA, investors and developers • Demand the RDA to take risks in utilizing redevelopment funding to support nontraditional, grassroots efforts for addressing the needs of the service areas. Rethinking how traditional redevelopment funding streams like those listed below can be towards these grassroots efforts: • Community Development Block Grants • Neighborhood Improvement Strategy Areas program • Neighborhood Stabilization Programs • Commercial Corridor Improvement Programs • Neighborhood Home Improvement Rebate Programs • Affordable Housing Programs • Business Improvement Districts • Enterprise Zones
LB RDA Central Project Area Innovative Redevelopment Examples from Throughout Los Angeles and Beyond Examples of Existing Projects/Collaborations Los Angeles Neighborhood Land Trust The Trust for Public Land Strategic Actions for a Just Economy Right to the City Alliance • Examples of Potential Projects/Collaborations • Community Land Banks as a means to: • preserve long-term affordable housing using CDBG money • assist local economic development efforts by supporting small to medium sized businesses (i.e. lowering the barriers to entry) • present an alternative model to neighborhood redevelopment • Community led adaptive reuse projects of existing liquor stores into healthy food corner stores • Earmarking RDA funds to support immediate and long-term community organizing efforts focusing on increasing neighborhood participation in the redevelopment process
SKILLS USED SLIDE NUMBER • 7, 24 • 25 • 18, 19 • 19 • 9, 15 • 5, 13, 14, 15, 16 • 11 • 4, 8, 9, 15 • 8, 9 • 4, 9 • 9, 18 • 16, 19 • Modeling • Metadata • Analysis • Measurement • Original Data • Charts, Graphs, Images • Hot Spot Analysis • Inset map • Point or line graduated symbol • Boundary sub-sets selections • Buffering • Geocoding