Download
1 / 58
580 likes | 722 Views
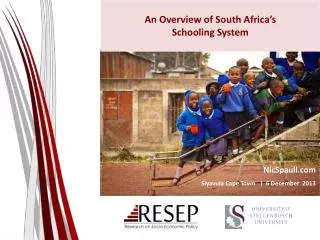
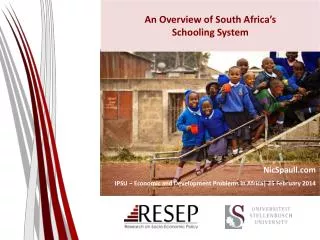
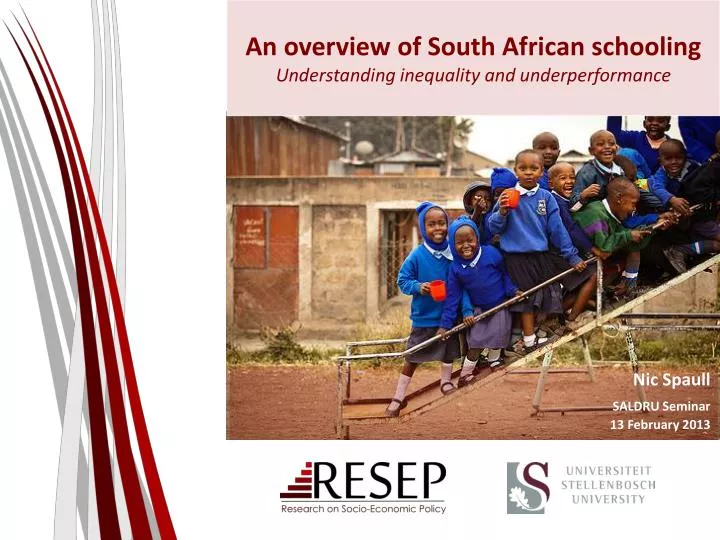
An overview of South African schooling Understanding inequality and underperformance. Nic Spaull SALDRU Seminar 13 February 2013. Outline. Overview of SA educational outcomes Theoretical links between schooling and the labour-market in SA

E N D
An overview of South African schooling Understanding inequality and underperformance Nic Spaull SALDRU Seminar 13 February 2013
Outline • Overview of SA educational outcomes • Theoretical links between schooling and the labour-market in SA • What do we know empirically about underperformance and inequality from SA data Grades 112? • What are some of the implications following from this? • Labour-market outcomes for youth (18-24) since 1995 • When you have 2 education systems how does this affect: • Reporting • Modelling • Conclusions & Recommendations
Not all schools are born equal ? Pretoria Boys High School SA public schools?
Education and inequality? • IQ • Motivation • Social networks • Discrimination
Labour Market • University/FET • Type of institution (FET or University) • Quality of institution • Type of qualification(diploma, degree etc.) • Field of study (Engineering, Arts etc.) • High productivity jobs and incomes (17%) • Mainly professional, managerial & skilled jobs • Requires graduates, good quality matric or good vocational skills • Historically mainly white High quality secondaryschool Unequal society High SES background +ECD High quality primary school Minority (20%) Some motivated, lucky or talented students make the transition • Vocational training • Affirmative action • Big demand for good schools despite fees • Some scholarships/bursaries Majority (80%) Quality Type Attainment Low quality secondary school • Low productivity jobs & incomes • Often manual or low skill jobs • Limited or low quality education • Minimum wage can exceed productivity Low SES background Low quality primary school cf. Servaas van der Berg – QLFS 2011
Gr 1 - Gr 2 - Gr 3 – Gr 4 – Gr 5 – Gr 6 – Gr 7 – Gr 8 – Gr 9 - Gr 10 – Gr 11 – Gr 12 ECD Foundation Phase Intermediate Phase Senior Phase FET Phase Foundation Phase Intermediate Phase Senior Phase FET Phase Mother-tongue instruction De facto / De jure ? Primary school Main drop-out zone High school
Gr 1 - Gr 2 - Gr 3 – Gr 4 – Gr 5 – Gr 6– Gr 7 – Gr 8 – Gr 9 - Gr 10 – Gr 11 – Gr 12 Foundation Phase Intermediate Phase Senior Phase FET Phase National School Effectiveness Study (NSES) • Grade 3 (2007); Grade 4 (2008); Grade 5 (2009) – Panel 268 schools • [All provinces except Gauteng] ____________________________________ Underperformance • Language: In 44% of Gr4 and 32% of Gr5 classes there was no paragraph writing done over the year (from best learner). • Mathematics: 88% of Gr5 maths teachers covered no more than 35 of the 89 topics (40%) in the gr5 maths curriculum Inequality • Frequency of paragraph writing (half a page or less) EC/KZN=1.7; WC=5.8 /year • Grade 3 students in historically white schools perform much better on the same test than grade 5 students from historically black schools Taylor, 2011
Gr 1 - Gr 2 - Gr 3 – Gr 4 – Gr 5 – Gr 6– Gr 7 – Gr 8 – Gr 9 - Gr 10 – Gr 11 – Gr 12 Foundation Phase Intermediate Phase Senior Phase FET Phase PIRLS 2006 – see Shepherd (2011) prePIRLS 2011 • Grade 4 – all 11 languages • 433 schools, 19259 students ____________________________________ Underperformance • 29% of gr4 students did not reach the low international benchmark – they could not read • SA performs similarly to Botswana, but 3 years learning behind average Columbian Gr4 Inequality • Linguistic inequalities: Large differences by home language – Xitsonga, Tshivenda and Sepedi students particularly disadvantaged • PIRLS (2006) showed LARGE differences between African language schools and Eng/Afr schools • Howie et al (2011) • *Data now available for download
Gr 1 - Gr 2 - Gr 3 – Gr 4 – Gr 5 – Gr 6– Gr 7 – Gr 8 – Gr 9 - Gr 10 – Gr 11 – Gr 12 Foundation Phase Intermediate Phase Senior Phase FET Phase SACMEQ 2007 • Grade 6 – Numeracy and literacy • 392 schools, 9071 students ____________________________________ Underperformance • 27% of students functionally illiterate • SA performs worse than many low-income African countries (Tanzania, Kenya, Swaziland, Zimbabwe) • No improvement between SACMEQ II (2000) and SACMEQ III (2007) • Although majority (98%) of students are enrolled, sometimes almost no learning Inequality • Large differences between quintiles (see table later) • Large inequalities in maths teacher content knowledge Gr 6 Teacher Content Knowledge - see McKay & Spaull (2013)
SACMEQ III (Spaull & Taylor, 2012) Literacy Numeracy
Gr 1 - Gr 2 - Gr 3 – Gr 4 – Gr 5 – Gr 6– Gr 7 – Gr 8 – Gr 9 - Gr 10 – Gr 11 – Gr 12 Foundation Phase Intermediate Phase Senior Phase FET Phase TIMSS 2011 • Grade 9 – Maths and science • 285 schools, 11969 students ____________________________________ Underperformance • 76% of Gr9 students had not acquired a basic understanding about whole numbers, decimals, operations or basic graphs (i.e. had not reached low int. benchmark) • Avg. Gr 9 SA student is 2yrs (2.8yrs) behind the average Gr8 student from a middle income country in maths (science) • Contrary to popular belief, even South Africa’s “top” schools do not perform well by international standards… Inequality • Avg Q1/Q2 Gr9 student is 3yrs (4yrs) worth of learning behind the average Q5 student in maths (science) • Avg Gr 9 student in ECA is 2yrs worth of learning behind avg Gr9 student in GAU *Data now available for download
Performance of quintile five schools in TIMSS 2003 Maths – see Taylor MST (2011) Even Q5 schools in SA perform at a comparatively low level
Gr 1 - Gr 2 - Gr 3 – Gr 4 – Gr 5 – Gr 6– Gr 7 – Gr 8 – Gr 9 - Gr 10 – Gr 11 – Gr 12 Foundation Phase Intermediate Phase Senior Phase FET Phase Matric • Grade 12 – Various • Roughly half the cohort ____________________________________ Underperformance • Of 100 students that enroll in grade 1 approximately 50 will make it to matric, 40 will pass and 12 will qualify for university Inequality • Subject combinations differ between rich and poor – differential access to higher education • Maths / Maths-lit case in point • Are more students taking maths literacy because THEY cannot do pure-maths, or because their TEACHERS cannot teach pure-maths?
See Taylor (2012) Matric • More students making it to grade 10 but not more making it to matric • Partially due to less repetition at lower grades • LARGE differences in the ability of provinces to “convert” grade 1 enrolments into matric passes • Why are more students taking mathsliteracy? The ratio of grade 2 enrolments ten years prior to matric to matric passes by province See Taylor (2012)
What are the root causes of low and unequal achievement? Matric pass rate Subject choice Throughput No. endorsements Media sees only this MATRIC Quality? Pre-MATRIC 50% dropout Low curric coverage Low accountability Weak culture of T&L Vested interests Low time-on-task No early cognitive stimulation Low quality teachers HUGE learning deficits…
Insurmountable learning deficits Gradients of achievement in the EASTERN Cape and in Quintile 5 (National) NB: Key assumption, 0.5 SD of national learning achievement is equivalent to one grade level of learning -agreement from TIMSS/PIRLS Spaull, 2013 Spaull 2013
Insurmountable learning deficits Gradients of achievement in the WESTERN Cape and in Quintile 5 (National) NB: WC has relatively high % of Q5 schools thus it should be more convergent by construction. Spaull, 2013 Spaull 2013
The impact of SES on reading/maths(SACMEQ III – 2007 Gr 6) • Almost 40% of SA student reading achievement can be explained by socioeconomic status (31 assets, books, parental education) alone. • In South Africa socioeconomic status largely determines outcomes (with a very small number of exceptions – see newspapers for examples) • Indication of wasted human capital potential (see Schleicher, 2009) Spaull, 2013
Bimodality – indisputable fact PIRLS / TIMSS / SACMEQ / NSES / ANA / Matric… by Wealth / Language / Location / Dept…
Poverty & Privilege paper • If there are indeed two education systems in SA and not one – as the background research seems to suggest - where/how do we draw the line between one and the other?
Background: Data SACMEQ • Southern and Eastern African Consortium for Monitoring Educational Quality • 14 participating countries • SACMEQ II (2000), SACMEQ III (2007) • Background survey • Testing : • Gr 6 Numeracy • Gr 6 Literacy • HIV/AIDS Health knowledge SACMEQ III: South Africa • 9071 Grade 6 students • 1163 Grade 6 teachers • 392 primary schools • See SACMEQ website for research
Two school systems not one? Socioeconomic Status • Grade 6 [2007] • Data: SACMEQ • (Spaull, 2011)
Corroborating evidence? • Latest data? ANA? • Teacher knowledge • Teacher absenteeism • Textbook access • Literacy/numeracy rates • Grade repetition • Parental education • Homework frequency
In most government reports outcomes and inputs are not usually reported by quintile, only national averages
Do the ends justify the means? Government reporting – means are misleading
Modelling student performance • Two data-generating processes. Little reason to believe there is the same underlying DGP • Split samples • Wealthiest 25% of schools • Poorest 75% of schools • Which coefficients are large & significant across the two regressions?
All of these things have serious ramifications for the labour market and thus income inequality…
Percentage of youth in employment by highest educational attainment (Van Broekhuizen, 2013) • Since 2007 more youth have matric • Employment rates of youth are stagnant at 20% since 1995 • For 18-24yr matric-only or less-than-matric doesn’t make much of a difference • Demand-Supply interaction between labour market and schooling Composition of 18 - 24-year-olds by highest level of education completed (Van Broekhuizen, 2013)
Percentage of unemployed 18-24-yr olds that have never worked (Van Broekhuizen, 2013) • In 2011 more than 70% of youth in unemployment had never been employed before • Durations of youth unemployment have been increasing since 1995 • Proportion of job-seeking youth unemployed for more than 3 years has increased from 42% in 2008 to 50% in 2011 Percentage of unemployed 18-24-year-olds by duration of unemployment (Van Broekhuizen, 2013)
Conclusions & Implications • Reporting education statistics in SA • Averages are uniquely misleading in SA – the average child does not exist in any meaningful sense • Report educational statistics by quintile in addition to province • You can’t solve a problem that doesn’t officially exist • Modelling educational performance in SA • Modelling a single education system when there are two can lead to spurious results • Policy differentiation • Policies suited to one system are not necessarily suited to the other • Don’t interfere with high-performing schools If it aint broke don’t (try) fix it • LITNUM intervention in WC Blanket approach We have 2 education systems in South Africa
When faced with an exceedingly low and unequal quality of education do we…. A) Increase accountability {US model} • Create a fool-proof highly specified, sequenced curriculum (CAPS/workbooks) • Measure learning better and more frequently (ANA) • Increase choice/information in a variety of ways B) Improve the quality of teachers {Finnish model} • Attract better candidates into teaching degrees draw candidates from the top (rather than the bottom) of the matric distribution • Increase the competence of existing teachers (Capacitation) • Long term endeavor which requires sustained, committed, strategic, thoughtful leadership (something we don’t have) C) All of the above {Utopian model} • Perhaps A while we set out on the costly and difficult journey of B??
Conclusions & Implications Persistent patterns of poverty and privilege
More research on… • Things we don’t really understand: • The impact of LOLT switching at grade 4 – should we be teaching in mother-tongue for longer? • Why districts are so dysfunctional • How to do in-service teacher training (existing programs don’t work) • The existing system of incentives facing national and provincial bureaucrats/politicians and how to change this • What the SA version of an accountable system of education looks like Nic’s PhD
Thanks. Comments & questions… Website: nicspaull.com/research Email: nicholasspaull@gmail.com Twitter: @NicSpaull
References • Fleisch, B. (2008). Primary Education in Crisis: Why South African schoolchildren underachieve in reading and mathematics. Cape Town. : Juta & Co. • Hoadley, U. (2010). What doe we know about teaching and learning in primary schools in South Africa? A review of the classroom-based research literature. Report for the Grade 3 Improvement project of the University of Stellenbosch. Western Cape Education Department. • Hungi, N., Makuwa, D., Ross, K., Saito, M., Dolata, S., van Capelle, F., et al. (2011). SACMEQ III Project Results: Levels and Trends in School Resources among SACMEQ School Systems. Paris: Southern and Eastern Africa Consortium for Monitoring Educational Quality. • Ross, K., Saito, M., Dolata, S., Ikeda, M., Zuze, L., Murimba, S., et al. (2005). The Conduct of the SACMEQ III Project. In E. Onsomu, J. Nzomo, & C. Obiero, The SACMEQ II Project in Kenya: A Study of the Conditions of Schooling and the Quality of Education. Harare: SACMEQ. • Shepherd, D. (2011). Constraints to School Effectiveness: What prevents poor schools from delivering results? Stellenbosch Economic Working Papers 05/11. [PIRLS] • Spaull, N. (2011a). A Preliminary Analysis of SACMEQ III South Africa.Stellenbosch Economic Working Papers. • Spaull, N. (2011). Primary School Performance in Botswana, Mozambique, Namibia and South Africa. Paris: Southern and Eastern African Consortium for Monitoring Educational Quality (SACMEQ) Working Paper no.8. • Spaull, N. 2012Equity & Efficiency in South African primary schools : a preliminary analysis of SACMEQ III South Africa Masters Thesis. Economics. Stellenbosch University • Taylor, S. (2011). Uncovering indicators of effective school management in South Africa using the National School Effectiveness Study.Stellenbosch Economic Working Papers 10/11, 1-51. [NSES] • Van der Berg, S., Burger, C., Burger, R., de Vos, M., du Rand, G., Gustafsson, M., Shepherd, D., Spaull, N., Taylor, S., van Broekhuizen, H., and von Fintel, D. (2011). Low quality education as a poverty trap. Stellenbosch: University of Stellenbosch, Department of Economics. Research report for the PSPPD project for Presidency.
Teacher knowledge... Q6: 53% correct (D) Q9: 24% correct (C) English Q9: 57% correct (D)
Literacy See Ross et al. (2005) Kenya Report
Numeracy See Ross et al. (2005) Kenya Report
Grade 6 Numeracy (V-ANA 2011) Correct answer (90 litres): 32% of Gr 6 students
Student competency levels • What proportion of students are reaching higher order competency levels?
Comparing SA & Botswana Source: Spaull, 2011
Two school systems not one Ex-department • Grade 4 [2008] • Data: NSES • (Taylor, 2011)
(Spaull & Taylor, 2012) (Hanushek & Woessmann, 2008)