Download
1 / 59
610 likes | 842 Views
Photochemical Smog The Major Air Pollutant in Taiwan. Shaw Chen Liu Researc h Center for Environmental Changes (RCEC) Academia Sinica NCU Seminar March 6, 2007. Acknowledgment. Ozone Research Team (sponsored by EPA) Dr. Chih-Chung Chang 張志忠 (Assistant RF)

E N D
Photochemical SmogThe Major Air Pollutant in Taiwan Shaw Chen Liu Research Center for Environmental Changes (RCEC) Academia Sinica NCU Seminar March 6, 2007
Acknowledgment Ozone Research Team(sponsored by EPA) Dr. Chih-Chung Chang 張志忠 (Assistant RF) Dr. Chun-Kuang Chou 周崇光 (Assistant RF) Dr. Chun-Yao Lin 林傳堯 (PD Fellow) Mr. Chien-Jung Shiu 許乾忠 (PhD candidate) (All above at RCEC) Prof. Po-Hsiung Lin 林博雄 (NTU Assist. Prof.) Prof. Julius Chang 張時禹 (NCU Prof.) Prof. Chia-Lin Wang 王家麟 (NCU Prof.)
Ozone can be "good" or "bad" for the environment, depending on its location in the atmosphere. • In the stratosphere, or "good" ozone layer protects life on Earth from the sun's harmful ultraviolet (UV) rays. • Ground-level or "bad" ozone is a pollutant that is a significant health hazard. It also damages vegetation. It is the main ingredient of urban smog.(Taiwan standard: 120 ppbv over 1 hour; US standard: 80 ppbv over 8 hours)
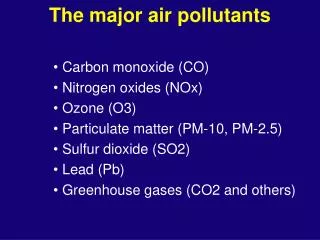
Why is Tropospheric Ozone Important? • Surface O3 is a health hazard; can also damage plants. • O3 is an important greenhouse gas in the upper troposphere. • O3 plays a pivotal role in the tropospheric chemistry: origin of all oxidants such as OH and H2O2.
A simplified O3 production mechanism In the presence of HO2 (RO2) and NOx, O3 can be produced via the following catalytic reactions HO2 (RO2) + NO -> NO2 + OH (RO) NO2 + hυ -> NO + O O + O2 + M -> O3 + M OH + CO (NMHC) + O2 -> HO2 + CO2 + RO2 ---------------------------------------------------------------- Net: CO (NMHC) + 2O2 + hυ -> CO2 + O3 + (RO) The O3 production tends to increase with HO2 (RO2), NOx, hυ, OH and CO (NMHC). But too much NOx can decrease OH and HO2. So can CO and NMHC.
Characteristics of Regional and Urban High Oxidants • Synoptic scale phenomenon superposed with urban scale influence • Complex relationship with precursors, NOx & VOC (including natural hydrocarbons)
LA county: site 1002 BURBANK COMMERCIAL URBAN AND CENTER CITY
Contributions (%) of various pollutants to high pollution days in 1993 – 2004 (Years+1911 are denoted by different colors) SO2 O3 CO PM10
Trends of monthly average SO2 from 1993 to 2004 (Years are denoted by different colors) Jan Apr Jul Oct
Trends of monthly average CO from 1993 to 2004 (Years are denoted by different colors) Jan Apr Jul Oct
Trends of monthly average NO2 from 1993 to 2004 (Years are denoted by different colors) Jan Apr Jul Oct
Trends of monthly average O3 from 1993 to 2004 (Years are denoted by different colors) Jan Apr Jul Oct
Taipei Average O3 (trend of 10 yrs: + 38.7%) Kaohsiung Average O3 (trend of 10 yrs: + 41.4%)
Policy Relevant Scientific Questions • What is the cause(s) of the increasing trend of O3 in Taiwan? • How do we control high O3? (What is the rate-limiting precursor of O3?)
Possible Causes of O3 Increase in the Last Decade • Photochemical production of O3 has increased? (No!) But O3 precursors NOx, VOC have been decreasing. • NO titration has decreased? (Yes!) • Long-range transport of O3 has increased? (Yes!)
Total oxidant Ox can be defined as follows (Liu 1977; Levy et al. 1987) + 1.5PAN + kn(RO2)n(NO)
O3+NO2 ≈ Total Oxidants • O3+NO2 characterizes the regional nature of oxidants better than O3. • O3+NO2 is a good measure of the real production rate of O3 (O3+NO2+PAN+HNO3 would be an even better measure).
Triangles are urban Taipei averages Red is a mountain station(900m) Green is a coastal station
Trends of Daytime O3 in Taipei ***Evidence of Titration Effect ***
Central/Western (CW) O3 Tsuen Wan (TW) Tai Po (TP)
Central/Western (CW) O3 + NO2 Tsuen Wan (TW) Tai Po (TP)
Recent Boundary Layer Ozone Trend at Okinawa 2.5 ± 0.6 %yr-1 Lee et al. Geophys. Res. Lett., 25, 1637-16490, 1998.
Possible Causes of O3 Increase in the Last Decade • Photochemical production of O3 has increased? (No!) But O3 precursors NOx, VOC have been decreasing. • NO titration has decreased? (Yes!) • Long-range transport of O3 has increased? (Yes!)
Policy Relevant Scientific Questions • What is the cause(s) of the increasing trend of O3? • How do we control high O3? (What is the rate-limiting precursor of O3?)
Peak O3 for various NOx and NMHC emissions in southern Taiwan (Chang et al., 2004)
EKMA plots are very useful for formulating ozone control strategies. • EKMA plots based on modeling results usually contain large uncertainties that exist in the emission inventories, meteorology parameters, photochemical processes, etc. • EKMA from Observation Based Models (OBM) can reduce the uncertainties by bypassing some of the processes.
Total oxidant Ox can be defined as follows (Liu 1977; Levy et al. 1987) + 1.5PAN + kn(RO2)n(NO)
O3 production rate derived from measured HO2, RO2 and NO (Mihelcic et al., 2003)
Solid lines are steady state model results. Dashed lines are the same except no isoprene. Symbols are values derived from measurements over the southeastern US. (Frost et al., 1998)
These two studies are very useful for studying the photochemistry of O3 production. But they did not link P(O3) to emissions of precursors or their early morning concentrations (i.e. initial concentrations which are proportional to emissions), as a result they are not very useful for formulating ozone control strategies. • In the following, we will develop an Observation Based Model (OBM) approach by linking ozone production rates to initial concentrations of precursors.
Total oxidant Ox can be defined as follows (Liu 1977; Levy et al. 1987) + 1.5PAN + kn(RO2)n(NO)
O3+NO2 ≈ Total Oxidants • O3+NO2 characterizes the regional nature of oxidants better than O3. • O3+NO2 is a good measure of the real production rate of O3 (O3+NO2+PAN+HNO3 would be an even better measure).
The ratio of two VOCs can be a measure of photochemical processing by OH (Calvert, 1976; Singh 1979) Chang et al. (2005) found the ratio ethylbenzene/m,p-xylene can be a good measure of the photochemical processing by OH: Ethylbenzene (E) reaction rate constant with OH is k1 = 7.0 x10⁻¹². If we follow a Lagrangian trajectory, then E(t) = E(0) Exp(-k1*OH*t). For m,p-xylene (X), k2 = 21.7 x10⁻¹² X(t) = X(0) Exp(-k2*OH*t). Where E(0) and X(0) are initial values or early morning values. In reality E(t) = E(0) Exp(-k1*OH*t) * F1(Transport), and X(t) = X(0) Exp(-k2*OH*t) * F2(Transport). Because E and X have same sources and sinks, their ratio should be little affected by the transport, i.e. F1=F2. Thus E(t)/X(t) = E(0)/X(0) Exp(-(k2-k1)*OH*t) From this equation (OH*t) can be evaluated from observed E/X.
Once we know OH*t, then NOx(t) = NOx(0) Exp(-k3*OH*t) where K3 = 6x10-12, NOx(0) is the early morning NOx or initial NOx. We can evaluate NOx(0) and [NOx(0) - NOx(t)] = consumed NOx(t). Similar equations can be written for VOCs. E.g. VOC1(t) = VOC1(0) Exp(-kvoc1*OH*t). And calculate [VOC1(0) – VOC1(t)] = consumed VOC1(t).
Remove DaLiou and Chauchou and Maynon stations R2 = 0.65 [O3+NO2] = 0.35*[initial NOx]+0.51*[initial VOCs] + 0.66
Peak O3 for various NOx and NMHC emissions in southern Taiwan (Chang et al., 2004)
How to control O3+NO2 in southern Taiwan? • Two-D OBM plots of O3+NO2 vs. initial VOC and NOx show that O3+NO2 increases significantly with VOC, but essentially independent of NOx! • Because reducing NOx decreases the titration of O3, control of NOx emissions will increase the O3 concentration. • This suggests that O3 levels in southern Taiwan are VOC-limited, but more data are needed.
Remaining Questions? • What are the photochemical processes contribute to the relationship between the total oxidant and its precursors? • Can we measure the photo-stationary state NO2/NO correctly? • What is the concentration of HONO? What is its source? • How important are gas-particle reactions? • How important are natural hydrocarbons, especially isoprene?
Causes of increasing trends of O3 in Taiwan from 1994 to 2004 • A decrease in NO titration due to reduced NO emissions contributes to about 6 ppbv increase in O3. • Long-range transport of increasing O3 in the Asian continent contributes to about 7 ppbv increase in O3. • So O3 concentrations in Taiwan should increase by about 13 ppbv. The observed increase in O3 in Taiwan is about 9 ppbv. The difference of 4 ppbv can be attributed to reduction in O3 production in Taiwan due to reduced emissions of O3 precursors, i.e. EPA’s contribution. • Between 1960 and 1993, background O3 in Taiwan probably increased by more than 10 ppbv due to long-range transport of greater regional and hemispheric O3.
Tropospheric Ozone – A Brief History Discovery of tropospheric O3: Schoenbein, 1840. Tropospheric O3 comes from the stratosphere: Regener, 1941. O3 as an air pollutant: Los Angeles, 1940s. Formation of O3 in smog: Haagen-Smit (1952) VOC (NMHC) + NOx + Sunlight → Ozone Proposal of HO2 (RO2) reactions in the smog: Leighton (1961) HO2 (RO2) + NO → NO2 + OH (RO) NO2 + hυ + O2 → NO + O3 Tropospheric O3 comes mostly from photochemical production: Crutzen (1972), Chameides and Walker (1973)
Where does the tropospheric O3 come from? • Downward flow from the stratosphere. • Photochemical production. Where does O3 go? • Surface deposition. • Photochemical destruction.
Key Questions About O3 Control • What is the rate-limiting precursor of O3 production? NOx or VOC? • Assuming it is VOC, then which VOCs are the major ones? • What are the major sources of the major VOCs?