Download
1 / 25
250 likes | 338 Views
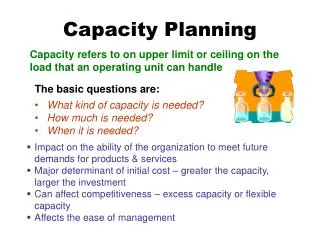
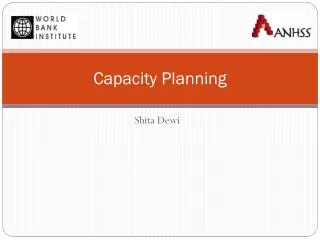
Capacity planning for railway systems Leo Kroon Jan 17, 2002. Conclusions Capacity planning at several levels Relevant resources are: Infrastructure Rolling stock Personnel . . . All relevant resources are scarce Effective utilization of resources is required

E N D
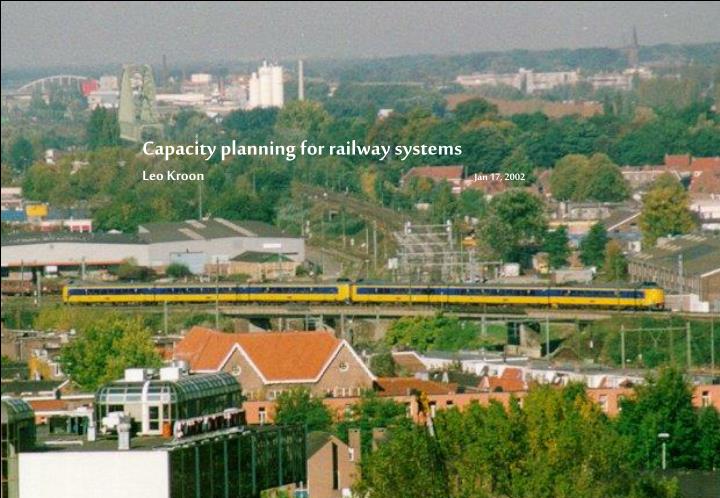
Capacity planning for railway systems Leo Kroon Jan 17, 2002
Conclusions • Capacity planning at several levels • Relevant resources are: • Infrastructure • Rolling stock • Personnel • . . . • All relevant resources are scarce • Effective utilization of resources is required • OR models can provide useful support
Dutch railway quantities 1.000.000 passengers per workday 14.000.000.000 passenger kilometers per year 5000 timetabled trains per workday 2800 kilometers of tracks 380 stations 2650 wagons 3000 train drivers 4000 conductors (and assistants)
Hourly Pattern for the track Rotterdam - Utrecht Rta Gd Wd Rtd Ut Nwk Rtn Cps Mda Gdg Hmla Vtn 0 0 500 10 10 21700 8800 9700 20 20 4000 2800 2000 30 30 2000 1700 2800 40 40 14000 8800 20500 9700 50 50 2800 2000 60 60
Platform Occupation Chart for Utrecht Central
Price per pkm in cents (Dfl) Dispunctuality (%) Utilization of the infrastructure (%) Source: Koppeling Dec 16, 2000
Capacity aspects (infrastructure) • Passengers vs. Cargo vs. Maintenance • Significant increase in demand is expected • Stations are a major bottle-neck • # Trains or # Passengers/Tons? • Utilization vs. Robustness • Different kinds of capacity (OptiRail) • Theoretical capacity • Practical capacity • Planned capacity
Capacity aspects (infrastructure: tracks) • # Parallel tracks • Heterogeneity of traffic • # Take-over facilities • Safety system (length of blocks) • Energy system (diesel/electric) • Rolling stock characteristics • Rolling stock capacity (per wagon/unit) • Environment (noise) • . . . .
Capacity aspects (infrastructure: stations) • # Platforms • # Parallel/simultaneous routes • Platform occupation times (length of return times) • # Shunting movements • # (Cross-platform) connections • Length of platforms • Rail-side vs. City-side • . . . .
time A F B C D E Traditional system 5 trains
time Clustered 7 trains A F B C D E
time A F B C D E Take-over 9 trains
time F A B C D E Homogeneous system 8 trains
time A F B C D E 2 tracks per direction 15 trains
Capacity analysis and utilization DONS/SIMONE: Feasibility and robustness (dependent on timetable) Model Huisman: Network of queuing systems (independent of timetable) OptiRail: Network flow model with discrete resources (independent of timetable) B & B: Benutten & Bouwen (Utilize & Expand)
Rolling stock • In rush hours: Allocation of scarce capacity • Outside rush hours: Efficiency
Koploper with 3 or 4 wagons Double decker with 3 or 4 wagons Mat’64 with 2 or 4 wagons q/.r
Capacity aspects (Rolling stock) Increasing demand during last years Additional wagons (units) will be available soon Rolling stock capacity mainly determined by - available # of wagons (units) - capacity per wagon (unit) - speed of the trains Available operational rolling stock capacity = (rolling stock capacity) - (maintenance reservation)
Capacity aspects (Rolling stock) Required operational capacity mainly determined during the morning rush hours Allocated capacity per trip => minimally required capacity - shortage Allocated capacity per trip = # wagons (units) * capacity per wagon (unit) Maximum train length <= minimum platform length
0.45 0.4 0.35 0.3 0.25 0.2 0.15 0.1 0.05 15% 0 m m+s • Minimally required capacity per trip • Based on counts by conductors
Eight o’clock cross section 7 8 9 line 1 line 2
Rolling stock allocation model Applied to 8 o’clock cross section of all stoptrains Implemented in ILOG OPL Studio Solved by CPLEX 7.0 on PC (900 MHz, 256 Mb) # variables: 3700 # constraints: 9600 Manual solution: Total shortages (2nd class) 4869 # trains with shortages 75 (of 188) Scenarios based on max. # types and subtypes per line: Best solution found: 3958 # trains with shortages 71 (of 188)
Waiting time vs. Utilization Waiting time 0 1 Utilization
Conclusions • Capacity planning at several levels • Relevant resources are: • Infrastructure • Rolling stock • Personnel • . . . • All relevant resources are scarce • Effective utilization of resources is required • OR models can provide useful support
Conference on Optimization in Public TransportMay 23, 2002, Erasmus University Rotterdam • http://www.few.eur.nl/few/research/ecopt/conference • Airline session: • Jacques Desrosiers GERAD and École des Hautes Études Commericales, Montréal • Gerrit Timmer; ORTEC Consultants and Free University Amsterdam • Railway session: • Paolo Toth; DEIS, University of Bologna, Italy • Leo Kroon; NS Reizigers and ECOPT, Erasmus University Rotterdam • Bus session: • Matteo Fischetti; DEI, University of Padua and Double-Click sas, Italy • Dennis Huisman; ECOPT, Erasmus University Rotterdam