Download
1 / 39
410 likes | 597 Views
Virtual performance won't do : Capacity planning for virtual systems. Ethan Bolker and Yiping Ding October, 2005. Everything we think we know is virtual. What we can measure and verify is limited. What Analysts are Saying?.

E N D
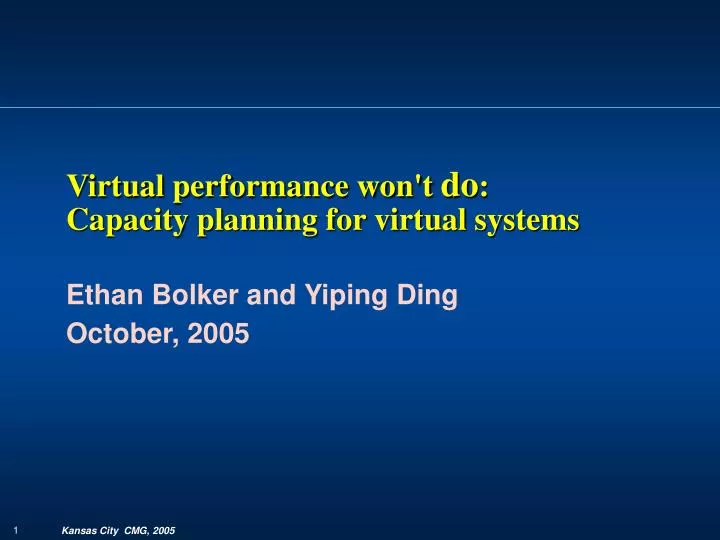
Virtual performance won't do: Capacity planning for virtual systems Ethan Bolker and Yiping Ding October, 2005
Everything we think we know is virtual What we can measure and verify is limited
What Analysts are Saying? • “Enterprises that do not leverage virtualization technologies will pay up to 40 percent more in acquisition costs by 2008, and roughly 20 percent more in administrative costs than enterprises that leverage virtualization technologies” • T. Bittman, Gartner Research – July 2003 What we see is not Reality. It is our Perception. Virtualization is the Perception. Perception is the Business.
The History of Computing Is A History of Virtualization
What is the “Performance” Model for that? Utilization = Throughput x Service time Utilization: % of system busy Throughput 1 1 S Service time
One job may take days to complete … Utilization = Throughput x Service time U = 1 job / 30 days x 3 days / job = 10% Response time almost equals service time Throughput 1 Days Service time
Multiprogramming: nontrivial performance modeling Utilization = Throughput x Service time U = 8 job / 1 min. x 0.1 min / job = 80% Throughput Multics x x R Response time = service time / (1 – U) = 0.1 / 0.2 = 0.5 min
Advanced Chips x x R
A Basic Computer System without Virtualization Applications U(Ai) Operating System Hardware U(P) Processors Memory I/O Subsystem Network Interface Sum of app utilization = processor utilization Capture Ratio: SUM of U(Ai) / U(P)
A Virtualized System Applications Applications OS OS Virtualized Layer Application Memory Processors Hardware I/O Subsystem Network Interface Operating System Hardware Network Interface I/O Subsystem Memory Processors
Three Basic Architectures of Virtualization • Virtualization Layer below the OS • Virtualization Layer above the OS • (Virtualization Layer both below and above the OS)
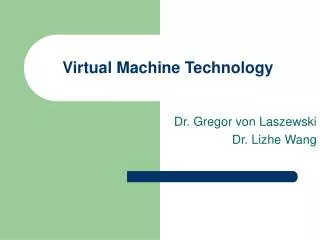
Virtual Machine Operating System and Applications Virtual Machine Operating System and Applications Virtual Hardware Virtual Hardware Virtual Server 2005 Windows Server 2003 IA-32 Server Microsoft Virtual Machine Technology Virtual Server is above and below the OS, like VMWare GSX
Virtual Machine Operating System and Applications Virtual Machine Operating System and Applications Virtual Hardware Virtual Hardware Virtual Server 2005 Windows Server 2003 IA-32 Server Model with Virtual Layer above OS • When Virtual Layer is above an OS, Virtual Layer is an extension of the OS Applications running on the new OS with OS like measurements. (ie, treat it as an application.) Any HW presented by an OS is virtual HW A New OS with additional measurements
Model with V Layer below OS • When V Layer is below OS, V Layer serves as a new OS An application with OS like measurements A new OS with new Measurements
Virtualization layer below operating system Applications New App Operating System Virtualized Layer Memory Processors New OS Network Interface I/O Subsystem Hardware Hardware Network Interface I/O Subsystem Memory Processors
Sun N1: Virtualization above and below OS Separately Administrable Solaris Instances OS
Definitions of utilization • Vj(P) = (virtual) processor utilization measured by guest j = sum( Vj(Ai) ) • Uj(P) = real processor utilization charged to guest j by the virtualization manager • U0(P) = real processor utilization the virtualization manager uses to do its work • Central question: does Vj(P) = Uj(P) ?
Guests and Virtualization Manager • Each guest runs its own OS • The OS could be different for different guests • Each guest knows nothings about the others • Performance data is collected at each guest • Only Virtualization Manager knows all and keeps track of the resource consumption of each virtual machine on the physical system • The Virtualization Manager schedule access to real physical resources to support each guest
Stretch-out! • We expect to see Vj(P) > Uj(P) • … the fraction of time the guest run queue is not empty is larger than the time charged to guest j by the manager, which may award the CPU cycles to some other guest, forcing guest j to wait even while it thinks it is processing work
Two virtual machines on one physical system Applications Applications V2(P) = sum V2(Ai) V1(P) = sum V1(Ai) Operating System Operating System Virtualized Layer Virtualized Layer Memory Processors, V1(P) Memory Processors, V2(P) Network Interface Network Interface I/O Subsystem I/O Subsystem Hardware Hardware Virtualization Manager Processors U(P) = sum Uj(P) Hardware Memory Network Interface I/O Subsystem
How to Allocate Resource among Guests • Each guest consumes as much of the processing power as it wishes, provided U(P) < 1 • (no shares assigned) • Assign each guest a (fraction) share f(j), which is interpreted as either a cap or a guarantee • When shares are caps,each guest owns its fraction of processing power, but no more than that • When shares are guarantees, each guest could consume more than its share when other guests are idle • In each of the three cases, we must know how to interpret the measurements in each guest
Easiest Case to Understand: Shares as Caps • Each guest is unaffected by other guests • The relationship between the guest Virtual utilization and the guest physical utilization is simple: Vj(P) = Uj(P) / f(j) • Vj(P) approaches 100% as Uj(P) approaches the cap f(j)
No Shares Assigned Each guest consumes as much of the processing power as it wishes, provided U(P) < 1 • Vi(P) = Ui(P) / [1 – (U(P) – Ui(P))] • Where Ui(P) ≤ U(P) ≤ 1 • Ui(P) ≤ Vi(P) ≤ 1 • If Ui(P) = U(P) then processor is busy for guest i only (and there is no overhead), thus Vi(P) = Ui(P) • Vi(P) is usually greater than Ui(P)
No Shares Assigned Vi(P) = Ui(P) / [1 – (U(P) – Ui(P))]
Shares as Guarantees • When shares are guarantees, each guest can consume more than its share when other guests are idle Vi = F(f1, …, fn, U1,…, Un) Virtual utilization depends on share and utilization of each guest
VMware experiments Guest 1: Bermuda Guest 2: Largo Windows 2000 Windows 2000 Virtualized Layer Virtualized Layer V(Bermuda) = ? V(Largo) = ? Processors Processors Hardware Hardware Virtualization Manager U(Bermuda) = 25% U(Largo) = 20% - 40% Hardware Processors, U(P) = 45% - 65%
VMware experiments: Guest Bermuda Guest 1: Bermuda Guest 2: Largo Windows 2000 Windows 2000 Virtualized Layer Virtualized Layer V(Bermuda) Processors Processors, V(Largo) Hardware Hardware Virtualization Manager U(Bermuda) = 25% U(Largo) = 20% - 40% Hardware Processors, U(P)
VMware experiments: Guest Largo Guest 1: Bermuda Guest 2: Largo Windows 2000 Windows 2000 Virtualized Layer Virtualized Layer V(Largo) Processors Processors, V(Bermuda) Hardware Hardware Virtualization Manager U(Bermuda) = 25% U(Largo) = 20% - 40% Hardware Processors
VMware measurements Same total utilization
Observations of VMware experiments • Guest’s utilization (Vi) was larger than the utilization attributed to it by the manager (Ui) Vi Ui
Observations of VMware experiments • The proportional utilization stretching is roughly constant for each guest, but different for the two guests
Observations of VMware experiments • The response time on each machine depends on the total utilization Total utilization Response Time
Observations of VMware experiments • When both guests ran at the same (approximate) load (Experiment 2), job response time was essentially the same on each
Main points / Summary • showed processor utilizations measured by the guest and by the virtualization manager need not agree • discussed the relationship between those utilization measurements when no shares have been assigned • proposed a methodology for computing how activity in one guest can affect the performance in others • suggested the value of using throughput rather than utilization as the independent variable when attempting to answer what-if questions about transaction response time
Future Work • find a virtualization system that allows us to specify “no shares” so that we can validate the model introduced in the paper • continue our experiments on VMware and other systems in order to understand share allocation semantics • develop a reasonably generic methodology for modeling at least the simplest of the share allocation semantics