Download
1 / 37
380 likes | 399 Views
Air emissions. Outline. Outline. Learning objectives Review of basics (5 min.) Level 1 What? why? (compilers) Concepts (15 min.) Group exercise and discussion (30 min.) Level 2 Data sources, country examples and issues (15 min.) Group exercise and discussion (15 min.)

E N D
Air emissions SEEA-CF - Air emissions accounts
Outline Outline • Learning objectives • Review of basics (5 min.) • Level 1 What? why? (compilers) • Concepts (15 min.) • Group exercise and discussion (30 min.) • Level 2 • Data sources, country examples and issues (15 min.) • Group exercise and discussion (15 min.) • Closing discussion (10 min.) SEEA-CF - Air emissions accounts
1. Learning Objectives Learning objectives • Level 1 • Understand what Air Emission Accounts are and why they are important • Understand the basic concepts of air emission accounting • Understand how air emissions are treated in the SEEA • Learn the steps of compiling an Air Emissions Account • Level 2 • Understand the common data options and sources • Understand the important conceptual issues • Be aware of how other countries have approached air emission accounting SEEA-CF - Air emissions accounts
2. Review of basics In the news… SEEA-CF - Air emissions accounts
3. Level 1 Level 1 • Why are air emissions important? • Flows of air emissions • Physical supply and use tables • What’s included (and not) SEEA-CF - Air emissions accounts
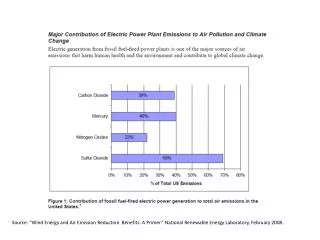
3. Level 1 Why are air emissions important? • CH4 • SF6 • N2O Contribute to Global Warming CO2 SO2 Policies to manage air emissions need reliable data on… Negative effects on ecosystem & human health • NH3 • amounts produced • and where • who releases them • PM10 • PM2.5 • NOx SEEA-CF - Air emissions accounts
3. Level 1 Air emissions and SDGs SEEA-CF - Air emissions accounts
3. Level 1 Flows of air emissions • Emissions to air are... • gaseous and particulate substances released to the atmosphere • by establishments and households • as a result of production, consumption and accumulation • Air Emissions Account records generation by resident economic units and by type of substance Why do we calculate emissions of resident economic units? To match with SNA. It is needed to calculate emissions intensities. SEEA-CF - Air emissions accounts
3. Level 1 Supply and use table for air emissions Where do they go? Who releases them? Why can’t you add them up? SEEA-CF - Air emissions accounts
3. Level 1 Total household GHG emissions increasing while intensity decreasing Source: CANSIM table 153-0046
3. Level 1 Flows of air emissions: some notes • All actual CO2 emissions should be included in the accounts • Includes CO2 emissions from burning of biomass • CO2 emissions from the burning of fossil fuels should be distinguished from CO2 emissions from biomass. • To improve comparison with emission inventories (e.g., IPCC) What are some examples of burning of biomass? SEEA-CF - Air emissions accounts
3. Level 1 Territory vs Residence principle Energy Statistics Energy Balances SEEA-Energy SEEA-CF - Energy Flow Accounts
3. Level 1 Bridge tables needed In • The national economy totals & categories of Air Emissions Accounts differ from those in emission inventories. • These differences are recorded and presented in bridge tables • Bridge tables convert between classifications and concepts Emission Inventories Air EmissionAccounts Not in • Based on territory • Activity classification • Based on residence • Industry classification SEEA-CF - Air emissions accounts
3. Level 1 Example of a bridge table Territorial Emissions + Residence principle II Residential Emissions Territorial emissions + Danish vehicles, airplanes and ships (Maersk) operating abroad. → doubled the residential emissions. What else could have been added (or subtracted)? Foreign national vehicles, airplanes and ships operating in Danish territory SEEA-CF - Energy Flow Accounts
3. Level 1 What’s excluded? Flows of air emissions within the environment are not in the scope for the accounts: • Transboundary flows of air emissions • Capture of gases by the environment, for example, carbon captured in forests and soil • Emissions such as unintended forest and grassland fires and human metabolic processes which are not the direct result of economic production • Secondary emissions (when substances combine to create new substances in the environment) What is an example of a human metabolic process that produces air emissions? What about other animals? Digestion Cows produce methane SEEA-CF - Air emissions accounts
3. Level 1 What is included? • Flaring and venting of e.g. natural gas • Emissions from manure collected and spread on agricultural land (dissipative use) • Leakages from accumulations (durable goods like refrigerators, landfills, etc.) should be recorded as they occur and attributed to the owner of the good at the time of the leakage SEEA-CF - Air emissions accounts
3. Level 1 Energy first/inventory first • Two general approaches are used: Inventory First Approach Energy First Approach National emission inventories (EMEP/CORINAIR, IPCC) Energy statistics/balances (Eurostat, IEA) Auxiliary data Energy accounts Auxiliary data Non-energy activity data Emission factors Air emissions accounts Source: Eurostat: Manual for Air Emissions Accounts SEEA-CF - Air emissions accounts
3. Level 1 Group exercise • Situation: • Have Energy Use table and CO2emissions factors • Also know that “other industries” generate 139,000 tonnes CO2 • Need to calculate: • CO2 emissions from use of energy products • Objective (Groups of 3-5; Not alone!): • Multiply energy use (PJ) by appropriate emission factor • Calculate total CO2 emissions from all sources • Report product totals and overall total and discuss results • Which industry and product is the largest contributor to overall emissions? SEEA-CF - Air emissions accounts
3. Level 1 Air Emissions accounts: Exercise Calculate CO2 emissions from Energy Use Table and CO2 emissions factors: 1. From Table 1, select relevant energy use 2. Multiply by appropriate CO2 emissions factors from Table 2. 3. Enter CO2 emissions inTable 3. Calculate totals for each product. 4. In Table 4, enter 139 as Non-energy-related CO2 emissions for Industrial processes for "Other industries" 5. Calculate total CO2 emissions in Table 5. Calculate total for all emissions. Note: Consumption of electricity does not directly generate CO2 Agriculture and Forestry consume 15 PJ of Gasoline (70 tonnes/TJ) = (15 PJ * 70 T/TJ) = 1050 thousand TCO2 SEEA-CF - Air emissions accounts
3. Level 1 The answers Emissions from accumulation Emissions from accumulation Emissions from accumulation Coal use by Electricity Supply is the largest contributor. SEEA-CF - Air emissions accounts
4. Level 2 Level 2: Country examples and data • Detailed guidance • Country examples: Denmark, Canada • Data sources and adjustments • Compilation challenges SEEA-CF - Air emissions accounts
4. Level 2 Detailed guidance EuroStat Manual for Air Emissions Accounts uses SEEA principles Intergovernmental Panel on Climate Change (IPCC) focuses on anthropogenic sources on national territory
4. Level 2 EuroStat • Data collected by Eurostat’s questionnaire to Member States SEEA-CF - Air emissions accounts
4. Level 2 EuroStat– Physical Energy Flow Accounts (PEFA) Builder • Application to record flows of energy from the environment (natural inputs), within the economy (products), and back to the environment (residuals) Starts with energy statistics Calculates energy residuals + Bridge table for residence/territorial conversion SEEA-CF - Air emissions accounts
4. Level 2 Country example - Denmark Why are almost half of CO2 emissions and almost all SO2 and NOx from Trade & Transport? SEEA-CF - Air emissions accounts
4. Level 2 Country example - Canada • Derived from emission inventory • Adjusted for residence principle • About 4% higher than inventory • Available by detailed industry • Many footnotes - = in account, not in UNFCCC + = in UNFCCC not in account SEEA-CF - Air emissions accounts
4. Level 2 Country example - Canada Used household survey to estimate fuelwood consumption major contributor to PM2.5 and CO SEEA-CF - Air emissions accounts
4. Level 2 Producing exports accounts for 46% of Canada’s greenhouse gas emissions • Requires calculating emissions on residence principle • Requires using I-O modelling to calculate “demand side” Exports Personal expenditure For example, electricity companies generate power so we can light, heat and cool our homes. All industrial production is “intermediate” for the benefit of final consumers. Construction, inventories, machinery and equipment, and government expenditures Source: Statistics Canada, The Daily, April 11, 2012 42
4. Level 2 Material and energy flow accounts The residence principle is required to calculate intensity measures. Intensity measures are useful for targeting efficiency measures (note decrease in intensity of Oil & Gas Extraction & Coal Mining) tonnes per thousand current dollars of production 43
4. Level 2 Data sources Existing data • Existing energy accounts, energy balances and statistics • Existing emissions inventories (e.g., IPCC reporting) • If none, create an energy account first! Surveys Conversion factors • Only if necessary • Exploit financial and administrative data first! • Use “best” national factors Administrative data • Expenditures on fuel (by type), consumption of fuel • Energy utilities • Derived from international sources • By sources and type • http://data.unescap.org/escap_stat/ ESCAP Statistical database SEEA-CF - Water accounts
4. Level 2 PRTR: Pollutant Release and Transfer Registers • If your country have PRTR, USE IT!! • OECD: International guidelines & data clearinghouse • Usually large emitters of large quantities • Canada: National Pollutant Release Inventory (NPRI) • Collected via mandatory questionnaire • Only specific substances • Publicly accessible maps, data • But…some substances, small emitters, mobile sources not covered Source: https://www.ec.gc.ca/inrp-npri/ SEEA-CF - Air emissions accounts
4. Level 2 Data sources and adjustments Source: Eurostat: Manual for Air Emissions Accounts SEEA-CF - Air emissions accounts
4. Level 2 Compilation challenges Adjusting for residence principle • Requires detailed data, maybe bridge tables Smaller emitters may not be included in inventories • Larger companies have engineers, who can estimate emissions • In Canada, tested Survey of Industrial Processes to obtain data Some emissions are difficult to measure directly • For example, CFCs (Chlorofluorocarbons) • Measure “apparent consumption”: • Domestic production + imports + opening stocks – exports – closing stocks Conversion factors may depend on type of fuel (use nationally-accepted ones) Locations of releases would be useful for some emissions • Some emission inventories include maps SEEA-CF - Water accounts
Discussion Group exercise - Discussion • Which air emissions are a concern in your country? • Does your country produce: • Energy Accounts? • Emissions inventory? • Air emission accounts? • What is the main data challenge in producing an air emissions account? SEEA-CF - Air emissions accounts
Take home points Take home points • Air Emission Accounts are a useful addition to emissions inventories to calculate intensities and align with SNA • They can serve to validate emissions inventories • Need to adjust emission inventories to “residence principle” • Territory and residence principle • Some elements can be easily calculated from Energy Accounts • Energy Accounts can be compiled from energy balances and statistics SEEA-CF - Air emissions accounts
References References • EuroStat. 2015. Manual for Air Emissions Accounts. http://ec.europa.eu/eurostat/web/products-manuals-and-guidelines/-/KS-GQ-15-009 • EuroStat. Physical Energy Flow Accounts Builder. http://ec.europa.eu/eurostat/web/environment/physical-energy-flow-accounts. • OECD Pollutant Release and Transfer Registers. http://www.oecd.org/chemicalsafety/pollutant-release-transfer-register/ • Statistics Canada. 2012. Human Activity and the Environment 2012: Waste management in Canada. http://www.statcan.gc.ca/pub/16-201-x/2012000/part-partie1-eng.htm; CANSIM Table http://www5.statcan.gc.ca/cansim/a26?lang=eng&retrLang=eng&id=1530114&tabMode=dataTable&p1=-1&p2=9&srchLan=-1 • Statistics Denmark. Air emissions Accounts. www.statistikbanken.dk/MRU1 • UN SEEA: http://unstats.un.org/unsd/envaccounting/seea.asp SEEA-CF - Air emissions accounts
Acknowledgements Acknowledgements • Presentation revised by Michael Bordt, ESCAP • Original created by Sokol Vako (UNSD) based on input from Ole Gravgård (Statistics Denmark) • Revised by Hye Kyeong Choi, ESCAP SEEA-CF - Air emissions accounts