Download

1 / 25
250 likes | 585 Views
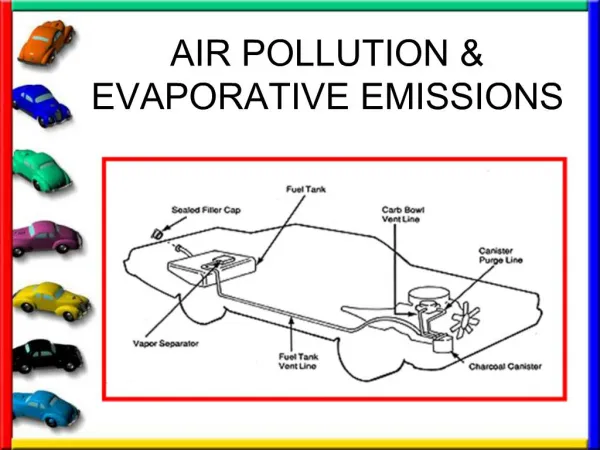
Air Emissions of Layer Barns (Buckeye Case) Building Environment Research & Education Albert J. Heber, Professor heber@purdue.edu AgAirQuality.com Agricultural and Biological Engineering Purdue University Objectives of Layer Barn Monitoring for Buckeye Case

E N D
Air Emissions of Layer Barns(Buckeye Case) Building Environment Research & Education Albert J. Heber, Professor heber@purdue.edu AgAirQuality.com Agricultural and Biological Engineering Purdue University
Objectives of Layer Barn Monitoring for Buckeye Case • Baseline particulate and ammonia emissions from three layer barns. • Compare emissions from new belt-battery barn with high-rise barns. • Evaluate effect of particulate impaction curtain on PM emissions of high-rise barn. • Evaluate effect of feed additive on ammonia emissions at high-rise barn.
Belt-Battery Barn Test Wind sensor 168,000-bird belt battery barn TEOM
٭ ٭ ٭ ٭ ٭ ٭ Monitoring Plan Belt-Battery Barn ٭ ٭ ٭ ٭ ٭ ٭ ٭ S Lab ٭ ٭ Barn 2 (belt batteries) Thermocouple RH/Temp probe ٭Activity sensor Air sampling (1-7) Static pressure port Wind sensor S Anemometer (SVA) TEOM microbalance Solar sensor F22 F16 F2 F8 F23 F1 4 5 6 7 Belt travel Front ٭ Rear Barn 2 (161.6 m x 15.85 m) ٭ 3 1 2 F46 F24 Instrument shelter F43 F35 F27 N 8 S Heated raceway Instrument shelter Manure belt
Exhaust Air Monitoring TSP sampler °C PM10 sampler Calibration gas line Gas sampling
Instruments/Analyzers PIR NH3 monitor PM10 monitors CL NH3 monitor UPS
Schematic of Air Sampling, Measurement, Calibration and GSS Test P: pump F: filter Bypass pumping circuit Exhausts M: manifold S: solenoid Teflon tubing (in mm): 9.5 OD 6.4 ID Sampling control Data acquisition 6.4 OD 3.2 ID Vinyl tubing (in mm): 6.4 OD 3.2 ID M1 M1 22.2 OD 15.9 ID P1 Fittings: Teflon Analyzers Nylon or other F Flow restrictor NH NH NH 3 3 3 NH 3 P3 Sampling probes, 10- 115 m long S8 Pressure sensor NH NH p p p 3 3 NH Fan 2 3 M3 M3 Fan 9 CO CO CO (2K) (2K) (2K) 2 2 2 CO 2 Fan 15 Mass flow meter Bag fill port Fan 22 f f Fan 29 M2 M2 P2 Disconnect for leakage test Fan 35 Rotameter (0- 250 mL/min) Fan 41 Balance air control valve Ambient S1 F Pressure sensor S9 p p p Sampling circuit P P P4 Pressure gage (optional) Analyzer calibration circuit Calibration gases Leak test circuit Diluter Diluter Jar
Gas Trends on Belt-Battery Test PC This graph shows an almost perfect increase of ammonia from the north end of the barn to the south end of the barn due to the accumulation of manure on the belt, which traveled only 1/ 7 of its length per day. At the same time, the carbon dioxide concentration was about the same indicating similar ventilation and number of birds along the length of the barn. N to S locations Ambient Ammonia (CL) Ammonia (PIR) Carbon dioxide Sample airflow rate
Mean barn exhaust NH3 concentration = 7.4 ppm Ambient concentration = 1.6 ppm Ambient temperature Barn exhaust NH3 Ambient NH3 Belt-Battery Barn NH3 Concentration and Ambient Temperature 30 25 C 20 o 15 Ammonia concentration, ppm; temperature, 10 5 0 8/8 8/15 8/22 8/29 9/5 9/12 9/19 9/26 10/3 Date
2 600 Mean NH3 emission= 0.60 lb/yr-bird, Ventilation =379 m3/s 500 400 NH3 Emission, lb/yr-bd Ventilation, m3/s 1 300 Ventilation 200 NH3 emission 100 0 0 8/8 8/15 8/22 8/29 9/5 9/12 9/19 9/26 10/3 Date Belt-Battery Barn Ammonia Emission and Barn Ventilation Rate
Activity Page at Belt-Battery Lab Ambient PM Birds Bird Activity Barn PM Workers Researcher (in lab) Manure belt
Belt-Battery Barn PM10 Concentrations and Emissions 1000 25 Mean barn PM10 = 316 μg/m3, Ambient PM10 =124 mg/m3 Gross emission = 10.8 kg/d or 64.2 g/d-bird 800 20 600 15 PM10concentration, μg/m3 PM10emission, kg/d-barn Gross PM10 emission Barn exhaust PM10 400 10 200 5 Ambient PM10 0 0 8/8 8/22 9/5 9/19 10/3 Date
Overall Means at Belt Battery Layer Barn(42 days: Aug. 10 – Sept. 30, 2004) • Inventory: 167,500 birds • Temperature: 20.9°C • Ventilation airflow: 379 m3/s • NH3 concentration: 7.4 ppm • NH3 emission: • 1.5 g/s • Maximum daily mean = 572 lb/d • 50 tons/yr • 0.60 lb/yr-bird • PM10 concentration: 470 μg/m3 • Net (gross) PM10 emission: • 37.3 g/d-bird (64.2 g/d-bird) • 2.51 tons/yr (4.34 tons/yr)
Test of High-Rise Barns 168,000-bird high-rise barn Instrument shelter
Monitoring Plan Monitoring Plan S S * * * * * * * * * * * * * * * * * * * * * * * * * * * * * * * * * * * * * * * * * * * * * * * * Cages Cages B B (4 tiers) (4 tiers) * * * * Pit Pit Pit Pit * * T T T T PIC PIC PIC PIC Barn 1 Barn 1 Barn 2 Barn 2 OFIS OFIS Thermocouple Thermocouple RH/Temp probe RH/Temp probe * * Activity sensor Activity sensor Fan vibration sensor Fan vibration sensor V V Air sampling (1 Air sampling (1 - - 13) 13) Static pressure port Static pressure port Wind sensor Wind sensor Beta gauge PM monitor Beta gauge PM monitor B B Anemometer (SPA) Anemometer (SPA) TEOM PM monitor TEOM PM monitor Solar sensor Solar sensor TSP sampler TSP sampler S S T T Fan number Fan number F47 F47 F38 F38 F29 F29 F50 F50 F26 F26 v v v v v v v v v v v v v v v v v v v v v v v v v v v v v v v v v v v v v v v v v v v v 8 8 8 12 12 11 11 8 8 10 10 9 9 9 9 10 10 9 9 10 10 8 8 10 10 9 9 10 10 9 9 10 10 9 9 8 8 10 10 9 9 10 10 9 9 9 9 10 10 8 8 * * * * * * 8 8 8 8 8 8 * * * Particulate impaction Particulate impaction Barn 2 (201 m x 21 m) Barn 2 (201 m x 21 m) * * * * * * * * * * curtain (PIC) curtain (PIC) * * * 2 2 2 2 * * * Fan stages Fan stages 1 1 * * * 7 7 7 10 10 9 9 5 5 6 6 7 7 4 4 5 5 6 6 3 3 7 7 4 4 7 7 6 6 5 5 7 7 3 3 7 7 4 4 6 6 3 3 7 7 4 4 6 6 5 5 T T v v v v v v v v v v v v v v v v v v v v v v v v v v v v v v v v v v v v v v v v v v v v F25 F25 F1 F1 F22 F22 F13 F13 F4 F4 N N On On - - farm instrument farm instrument B B * * shelter (OFIS) shelter (OFIS) F47 F47 F38 F38 F29 F29 F50 F50 F26 F26 13 13 v v v v v v v v v v v v v v v v v v v v v v v v v v v v v v v v v v v v v v v v v v v v 1 1 1 5 5 6 6 * * * T T 4 4 8 8 7 7 10 10 9 9 8 8 9 9 5 5 9 9 7 7 10 10 4 4 10 10 7 7 8 8 5 5 9 9 7 7 10 10 7 7 9 9 10 10 * * * 3 3 3 3 1 1 * * * * * * Barn 1 (201 m x 21 m) Barn 1 (201 m x 21 m) * * * * * * * S S * * * * * * 2 2 2 2 3 3 3 3 2 2 4 4 * * * 8 8 9 9 10 10 6 6 8 8 4 4 10 10 7 7 9 9 5 5 9 9 6 6 10 10 4 4 8 8 6 6 10 10 9 9 6 6 8 8 5 5 6 6 v v v v v v v v v v v v v v v v v v v v v v v v v v v v v v v v v v v v v v v v v v v v F25 F25 F1 F1 F22 F22 F13 F13 F4 F4 Curtain Test at High Rise Barns
Curtain Test DAC Screen Particulate Impaction Curtain
PM10 Concentrations at High-Rise Barns Mean PM10 concentrations, B1 = 375; B2 pit center =565; B2 curtain east = 343; B2 curtain west = 361 mg/m3 Barn 2 pit center Curtain west Barn 1, no curtain Curtain east
PM10 Emissions of High-Rise Barns Mean PM10 emissions, B1 = 60; B2 pit center = 108; B2 curtain treated = 72 g/day-bird Barn 2 pit center Barn 2 curtain Barn 1 control
NH3 Concentrations at High-Rise Barns Mean Barn1 exhaust NH3 = 14.9 ppm; Barn2 exhaust NH3 = 16.4 ppm; ambient = 3.9 ppm Downtime Barn 2 exhaust NH3 Barn 1 exhaust NH3 Ambient NH3
Ammonia Emission and Airflow at High Rise Barns Mean B1 NH3 emission = 0.73 lb-yr-bird; B2 NH3 emission = 1.12 lb-yr-bird Barn 1 Airflow Barn 2 Airflow Barn 2 NH3 Barn 1 NH3
Overall Means at HR Layer Barns (37 d: August 1 – Sept. 30, 2004) • 167,700 birds • Ammonia concentration: 15.6 ppm • Temperature: 19.0°C • Barn airflow: 329 m3/s • Ammonia: • 2.2 g/s (max daily mean = 1,131 lb/d) • 77 tons/yr • 0.93 lb/yr-bird • PM10 concentration: 470 μg/m3 • PM10 emission: 30.8 g/yr-bird = 5.6 tons/yr • Curtain reduced PM10 by 39%.
NH3 Emission Factors/Rates EF lb/yr-bird Reference Barn-days Emission Factor High-rise barns Valli et al., 1991 20 87 lb NH3/AU-yr 0.87 Yang et al., 2000 41.6-74.8 % of N 0.90 Lim et al., 2004 125 251-718 g/d-AU 1.26 Ni, et al., 2004 26 322-1437 lb/d 1.15 Liang et al., 2004 520 0.17-1.74 g/d-hen 0.69 Heber et al. 2004 74 0.93 lb/yr-bird 0.93 Belt-battery barns Heber et al. 2004 42 0.60 lb/yr-bird 0.60 Liang et al., 2004 208 0.01-0.23 g/d-hen 0.06