Download
1 / 25
280 likes | 599 Views
PUBLIC TRANSPORT. Moving People – Hearts & Minds. Heather Webster Executive Director Public Transport Division. Lack of Parking Puts Train Users on Road Linton Besser More than 40% of motorists who otherwise drive all the way to work would rather park at a station and commute.

E N D
PUBLIC TRANSPORT Moving People – Hearts & Minds Heather Webster Executive Director Public Transport Division
Lack of Parking Puts Train Users on Road Linton Besser More than 40% of motorists who otherwise drive all the way to work would rather park at a station and commute. Travel times getting longer Lauren Novak PEAK hour could blow out over the next decade if nothing is done to stop the build-tip of traffic congestion on Adelaide roads. The car is doomed, scientist warns Clay Lucas CAR travel should be cut by 80%, road construction halted and public transport boosted if Australia is to meet carbon emission targets, energy experts have warned.
Adelaide Metro • 220,000 journeys each weekday • 65 million journeys a year • $ 270 million per year to operate • $ 70 million per year in fare revenue • $ 3 subsidy for each journey on average
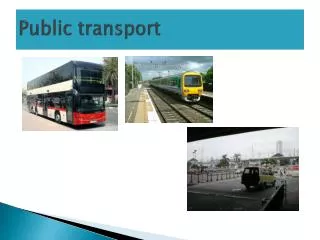
Vehicles Infrastructure 810 – Buses 94 – Rail Cars 15 – Trams
Track - Infrastructure • Shared and Segregated • 120 km of Train Line • 12.5 km Tram Line • 12 km of O-Bahn Track • 1440 km of Bus Routes • Service Contractors Objectives • Maintain a viable business and earn reasonable profit
Revenue Infrastructure • Ticketing • 1,800 Validating machines • 650 Outlets selling Metrotickets • GPS monitoring of services • $70 million ticket revenue • (2006 - 07financial year)
Fuel Infrastructure • Diesel - 21 million litres per annum • CNG – 297,874 GJ’s per annum • Bio Diesel (B5 moving to B10) - • 1.5 million litres per annum
Dedicated Public Transport Infrastructure Capital value - $1.5 billion
Increasing Public Transport Use How to get people from cars to public transport? Comfortable, Fast, Safe, Reliable, Well Priced Frequent Services Over 45% of adults have difficulty understanding timetables
Who benefits from the use of public transport The individual The environment Other road users The city
Strategies Driving Patronage Growth Bus Network: 80% of trips Train and Tram: 20% of trips Adelaide Milestones • O-Bahn • CTC 3. Marketing 4.Trams
Results of Contracting In first 10 years: • $193 million • $ 52 million • 14% more service • 15% more patronage Cost savings Extra Revenue Plus
Information Infrastructure • 5,993 stops with Information • 33 Smart Stops – showing real time information • 37 fully illuminated Interchange display units • Website - 17 million hits
Information Infrastructure • 5,600 Nomad onBoard subscribers • 187,000 sms and e mail messages sent per annum • 400 Info outlets distributing 4.3 million timetables per annum • 800,000 visitors to the Adelaide Metro InfoCentre per annum • 540,000 calls to the Adelaide Metro InfoLine per annum
Strategies for Growth – Short to Medium Term Increases to: Bus Priority Frequency Capacity Park'n'Ride Rail track quality New ticketing system
Strategies for Longer Term Growth • Extend bus routes • Extend train and tram lines • Electrify and standardise train lines
Support for Public Transport Strategic Plan Target (10% weekday car kms – currently 7%) Increasing patronage Climate Change Congestion and costs Public opinion
Motivations To Change Travel Behaviour • Frequency • Low fares • Weekend Services • Reliability • Faster
Potential Users 70% travel in the peak Latent demand: Between 30% and 50%
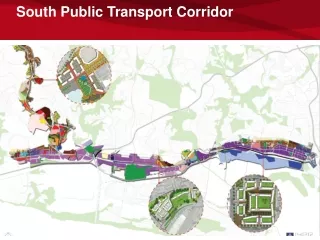
The Competitive Challenge A clean, uncluttered modern city has attractive public transport for easy travel
Bus– the Quick Fix Short lead time Incremental Reach and Accessibility Flexible Cheaper
Choose the mode to fit the task not bend the task to fit the mode Whichmode fits your task? Metro Standard Rail LRT Tram Bus Busway
Change is unavoidable but outcomes can be chosen Changes to Fuel Price, Energy Source, Vehicle Type, Travel Habits Will change the dynamics of a city
Summary Good public transport is essential for a civilised city • It depends on • City Design • Fuel Prices to accelerate change • Acknowledgement of the broader benefits