Download
1 / 16
160 likes | 233 Views
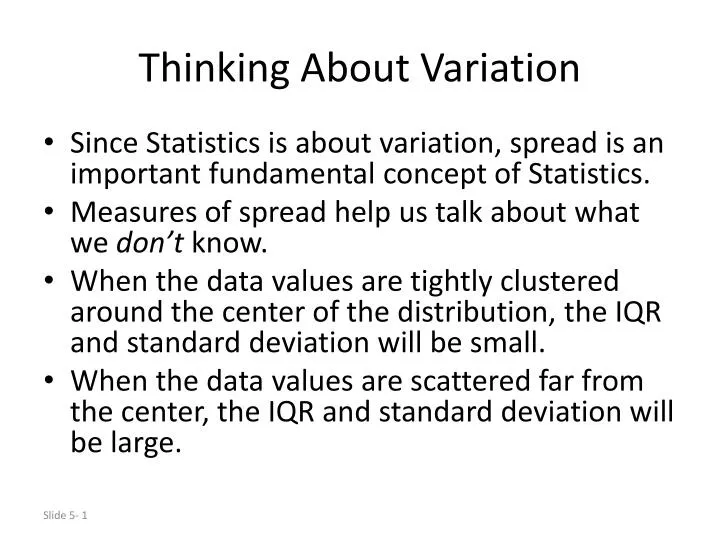
Thinking About Variation. Since Statistics is about variation, spread is an important fundamental concept of Statistics. Measures of spread help us talk about what we don’t know.

E N D
Thinking About Variation • Since Statistics is about variation, spread is an important fundamental concept of Statistics. • Measures of spread help us talk about what we don’t know. • When the data values are tightly clustered around the center of the distribution, the IQR and standard deviation will be small. • When the data values are scattered far from the center, the IQR and standard deviation will be large.
Shape, Center, and Spread • When telling about a quantitative variable, always report the shape of its distribution, along with a center and a spread. • If the shape is skewed, report the median and IQR. • If the shape is symmetric, report the mean and standard deviation and possibly the median and IQR as well.
Why is Spread so important??? List 1 : 55, 56, 57, 58, 59, 60, 60, 60, 61, 62, 63, 64, 65 mean = median = mode = 60 X X XXXXXXXXXXX . 35 40 45 50 55 60 65 70 75 80 85 List 2 : 35, 40, 45, 50, 55, 60, 60, 60, 65, 70, 75, 80, 85 mean = median = mode = 60 X X ___ X X X X X X X X X _ X X . 35 40 45 50 55 60 65 70 75 80 85 Both distributions have the same mean, median, and mode, but differ in their variation (or spread)
What does St. Dev. tell us? Standard deviation is a measure of the variation – Big st. dev. indicates a lot of variation, so the data is scattered far from the center Little st. dev. indicates not much variation, so the data is clustered around the center Zero st. dev. indicates no variation, so the data values are all the same as the mean
Stem-and-Leaf Displays • Stem-and-leaf displays show the distribution of a quantitative variable, like histograms do, while preserving the individual values. • Stem-and-leaf displays contain all the information found in a histogram and, when carefully drawn, satisfy the area principle and show the distribution.
Stem-and-Leaf Example • Compare the histogram and stem-and-leaf display for the pulse rates of 24 women at a health clinic. Which graphical display do you prefer?
Comparing a Histogram to a Stemplot Both graphs show the first 36 months of Enron monthly stock price changes.
Comparing a Histogram to a Stemplot Both graphs show the first 36 months of Enron monthly stock price changes.
Simpson’s Paradox • This occurs when an association you make from categorical variables is “reversed” when you consider a third variable.
Example The frequency table shows the heights (in inches) of 130 members of a choir. Enter the data into your calculator – put the heights into L1 and the frequencies into L2
Example To find the five-number summary: 1-var stats L1, L2 To create a boxplot of the distribution:
Example Zoom-9 to graph!! Set up Plot 2 as a histogram:
Example Zoom-9 to graph!!