Download
1 / 23
230 likes | 240 Views
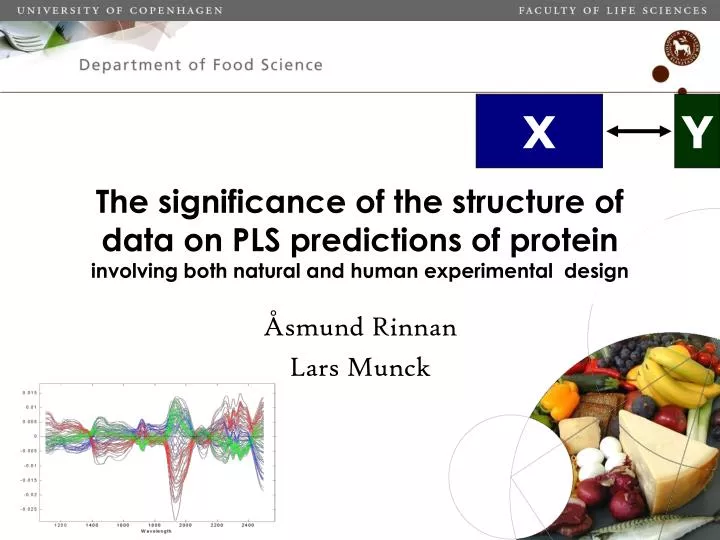
The significance of the structure of data on PLS predictions of protein involving both natural and human experimental design. X. Y. Åsmund Rinnan Lars Munck. Three Data-sets of barley. A. B. C. Rinnan Dataset Preprocessing PCA iPCA PLS Biology PLS - again Summary Munck

E N D
The significance of the structure of data on PLS predictions of proteininvolving both natural and human experimental design X Y Åsmund Rinnan Lars Munck
Three Data-sets of barley A B C Rinnan Dataset Preprocessing PCA iPCA PLS Biology PLS - again Summary Munck Permutation Mutants Diff spec Data structure Genetics Conclusion 31 31 54 Natural Simulated DoE B + C: The major substances protein, starch, cellulose, beta-glucan, fat and water are weighted to represent biological composition Normal barley Protein mutants Carbohydrate mutants All measured on NIR 6500 from 1100-2498nm with 2 nm intervals
Pre-processing of spectra MovingWindow SNV with 130 nm window The1580-2498 nm spectral area visualizestheleastdifferences betweenthethree data sets Rinnan Dataset Preprocessing PCA iPCA PLS Biology PLS - again Summary Munck Permutation Mutants Diff spec Data structure Genetics Conclusion
PCA 1100-2500nm Rinnan Dataset Preprocessing PCA iPCA PLS Biology PLS - again Summary Munck Permutation Mutants Diff spec Data structure Genetics Conclusion
Interval PCA selects 1804-2060 nm givingtheleastdifferencesbetweendatasets. Rinnan Dataset Preprocessing PCA iPCA PLS Biology PLS - again Summary Munck Permutation Mutants Diff spec Data structure Genetics Conclusion
Predicting proteinUsing the three datasets Rinnan Dataset Preprocessing PCA iPCA PLS Biology PLS - again Summary Munck Permutation Mutants Diff spec Data structure Genetics Conclusion Regression coefficients
PLS diagnostics (to protein) A.Simplecorrelationcoefficients: wave-lengthabsorbtion to protein content. Rinnan Dataset Preprocessing PCA iPCA PLS Biology PLS - again Summary Munck Permutation Mutants Diff spec Data structure Genetics Conclusion Natural Simulated DoE B.PLS Regression coefficients
Isolatingthechemical and biologicalcomponents of thedata-sets. A B C Rinnan Dataset Preprocessing PCA iPCA PLS Biology PLS - again Summary Munck Permutation Mutants Diff spec Data structure Genetics Conclusion 31 31 54 Natural Simulated Natural DoE RestBiology SimBiology SimBiology Chemistry Chemistry Chemistry SimBiology = B – C RestBiology = (A–C) – (B–C)
Predictingprotein: by PLS: Chemistry and non simulated(rest) biology show highcontributionswhilethat of simulatedbiology is low. Rinnan Dataset Preprocessing PCA iPCA PLS Biology PLS - again Summary Munck Permutation Mutants Diff spec Data structure Genetics Conclusion
Normalized regression coefficients Rinnan Dataset Preprocessing PCA iPCA PLS Biology PLS - again Summary Munck Permutation Mutants Diff spec Data structure Genetics Conclusion
Back to data, selected wavelengths Full PLS Correlation-PLSWavelengths abs to protein Assignment PLSPhil Williams Rinnan Dataset Preprocessing PCA iPCA PLS Biology PLS - again Summary Munck Permutation Mutants Diff spec Data structure Genetics Conclusion
Quick comparison Rinnan Dataset Preprocessing PCA iPCA PLS Biology PLS - again Summary Munck Permutation Mutants Diff spec Data structure Genetics Conclusion
Results: Summary Rinnan Dataset Preprocessing PCA iPCA PLS Biology PLS - again Summary Munck Permutation Mutants Diff spec Data structure Genetics Conclusion
Interpretation: We areworking by ”Permutationscience”: • 1.By mathematical validation of models permutation of data in chemometrics i.e cross-validation Rinnan Dataset Preprocessing PCA iPCA PLS Biology PLS - again Summary Munck Permutation Mutants Diff spec Data structure Genetics Conclusion
”Permutationscience”: • 2.Design of Experiments (DoE) Permutation of data through experiments by human design. Rinnan Dataset Preprocessing PCA iPCA PLS Biology PLS - again Summary Munck Permutation Mutants Diff spec Data structure Genetics Conclusion
”Permutationscience”: • 1.By mathematical validation of models permutation of data in chemometrics i.e. crossvalidation • 2.Design of Experiments (DoE) Permutation of data through experiments by human design. • 3. Natural design Permutation by selection of unique natural states where nature reveals its principles in data. Question: In chemometrics why not combine them all rather than focusing on mathematical permutation alone? All three permutation approaches are in the heart of chemometric validation of models! Why not use them together as we have done here. They are complementary. Rinnan Dataset Preprocessing PCA iPCA PLS Biology PLS - again Summary Munck Permutation Mutants Diff spec Data structure Genetics Conclusion
Principles of natural processesare reflected in data • The solar eclipse reveals solar eruptions • The NIR barley endosperm mutant model developed since 1965 with expression control of genetics and environment Two types of mutants: regulative protein mutants – Pand carbohydrate (starch) mutants – C(normal barley – N) Rinnan Dataset Preprocessing PCA iPCA PLS Biology PLS - again Summary Munck Permutation Mutants Diff spec Data structure Genetics Conclusion *) J.Chemometrics 24: 481-495 (2010) *) http://science.nationalgeographic.com/science/enlarge/solar-eclipse-moon.html
How were the mutants found? By a bi-variate plot % proteinto mmol DBC (Dye binding capacity by acilanorange) Rinnan Dataset Preprocessing PCA iPCA PLS Biology PLS - again Summary Munck Permutation Mutants Diff spec Data structure Genetics Conclusion Highlysine Mutation Mutation recombinants The Dyebinding Capacity (DBC) instrument for basic amino acids (lysine). Background: Development of screening methods for improving lysine and nutritional quality in barley LM at the nutritional laboratory of the Swedish seed Ass. Svalöf in 1967. DBC % protein Normal recombinants
Selectingendosperm mutants A/P = Amide Nitrogen to Protein 20 Any chemical (bi-)plot can select any mutant. N N Normal 18 N N A/P vs. b-gulcan Vitamin E profile N N N N N N N N N N w2 N N N N N N N N 5f 5g N N N 5g_ 5g_ Nb N N N 16 N 5f_ 5g_ 5g_ 16 16 5g 5g 5f_ 5f_ 5g 5f w1 449 449 Rinnan Dataset Preprocessing PCA iPCA PLS Biology PLS - again Summary Munck Permutation Mutants Diff spec Data structure Genetics Conclusion A/P 5g 5f 5g 14 High β-glucan 4d 3c 3a_piggy 12 3a 3b 3b 3a 3c 3a 3a_ 3a_ 10 3m 3m High Lysine 8 2 4 6 8 10 12 14 16 18 20 β-Glucan No data Conclusion: Each mutant produces a unique chemical fingerprint for each individual gene in a controlled genetic background (Bomi). The fingerprint is summerized on the level of chemical bonds by NIR spectroscopy. Cellular computation is soft like a PCA. J.Chemometrics 24: 481-495 (2010)
Therearedeterministic differential NIR spectra for each mutant to thegenebackground Bomi that reveals a spectral absorption reproducibility as high as 10-5 MSC log 1/R for the P mutant lys3.a(blue) and the C mutant lys5.g (brown). Rinnan Dataset Preprocessing PCA iPCA PLS Biology PLS - again Summary Munck Permutation Mutants Diff spec Data structure Genetics Conclusion
Scores N 0.10 PC2 • w1 • 5g • w2 C • 16 • Bomi • 5g 0.05 • CAII • 5f • 449 • Minerva • Nordal • 95 • 449 • Nordal 0 BG = 12.3 • Triumph • 3c -0.05 • 4d P • 3a • Lysiba • 3a -0.10 • Lysimax • 3m BG = 3.7 • 3b PC1 -0.15 -0.20 -0.10 0 0.10 0.20 Data structure is super-ordinate to chemometric analysis Rinnan Dataset Preprocessing PCA iPCA PLS Biology PLS - again Summary Munck Permutation Mutants Diff spec Data structure Genetics Conclusion The 3a and 3c P mutants are differentiated in this PCA 3c 3.2 3a However, spectral differences in the area 2450-2500nm represent a much more finely tuned and informative change in β-glucan from 3.1% in 3a to 6.4% in 3c
How is the chemical composition of the cell decided? Through soft modeling of intercellular dynamics of the whole cell by quantum and chemical cross-talk as revealed by the movements of chromosomes at mitosis (click at the left figure). Rinnan Dataset Preprocessing PCA iPCA PLS Biology PLS - again Summary Munck Permutation Mutants Diff spec Data structure Genetics Conclusion Cell emergence is like music as directed by the whole chemical orchestra of the cell
Conclusion • Biological macro data are basically deterministic calculated in situ by “set probability” controlled by the whole cell • Holistic analysis is limited by uncertainty specified as irreducibility “top down” and indeterminacy “bottom up” • The structure of data is the king that rules mathematical modeling by data inspection • Because of the determinism that here is demonstrated, data development of gentle data models (such as MSC) and data inspection software are of essential importance in avoiding a reduction of information. • Chemometrics is excellent for over- views but the results have to be checked by data inspection, Rinnan Dataset Preprocessing PCA iPCA PLS Biology PLS - again Summary Munck Permutation Mutants Diff spec Data structure Genetics Conclusion