Download
1 / 48
480 likes | 623 Views
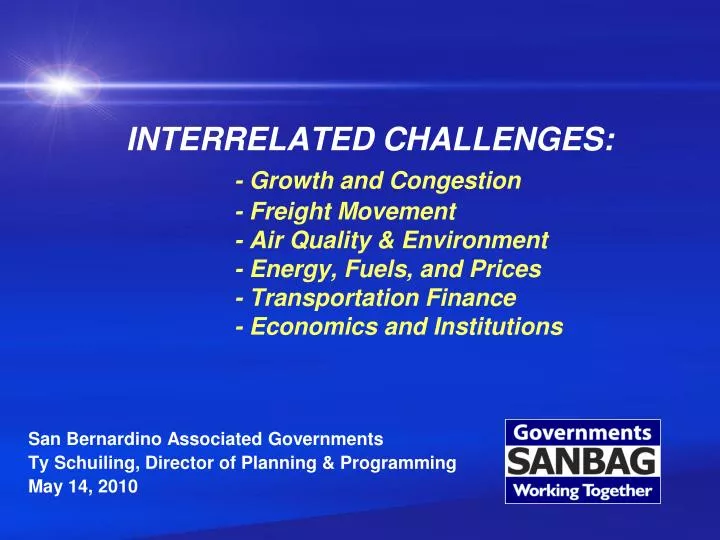
INTERRELATED CHALLENGES: - Growth and Congestion - Freight Movement - Air Quality & Environment - Energy, Fuels, and Prices - Transportation Finance - Economics and Institutions. San Bernardino Associated Governments Ty Schuiling, Director of Planning & Programming May 14, 2010.

E N D
INTERRELATED CHALLENGES:- Growth and Congestion - Freight Movement - Air Quality & Environment - Energy, Fuels, and Prices - Transportation Finance - Economics and Institutions San Bernardino Associated Governments Ty Schuiling, Director of Planning & Programming May 14, 2010
SCAG Region…forecast growth like adding the cities of Chicago and Houston in the next 25 years SCAG Region 2035 Forecast Population & Employment Growth (Millions) 2008 2035 Increase Population18.6 23.8 28 % Employment7.8 9.9 27% 2
Who will they be?? More Diverse… SCAG Region Population Growth 2005-2025 Older… Demographic data and analysis provided courtesy Frank Wen, SCAG
Added households will be much older!SCAG Region Households Growth Age 2005-2025 Demographic data and analysis provided courtesy Frank Wen, SCAG And household composition is changing: Household Type 1960 2005 2040 HH with Children 48% 32% 26% HH without Children 52% 68% 74% Single/Other HH 13% 31% 34% Source: Arthur C. Nelson, Presidential Professor & Director of Metropolitan Research, University of Utah
Huge Shift in Age of Population: From wage-earners to retirees Income Earners & Taxpayers 1975 - 2000 Under 20 21-64 65+ 27.5% 61.4% 11.1% 2000 -2025 Under 20 21-64 65+ 31.4% 38.9% 29.7% Demographic data and analysis provided courtesy Frank Wen, SCAG
Growth in 65+ cohort, 1970 - 2040 Demographic data and analysis provided courtesy Frank Wen, SCAG Personal Income Taxes Paid By Californians – by age We are here Source: California State Controller
Average households by age group: Incomes Expenditures (think sales tax) Source: 2000 Consumer Expenditure Survey
Average Government Service Expenses by age $18,000 $16,000 Health Care $14,000 $12,000 Social Security $10,000 Public Education $8,000 $6,000 $4,000 $2,000 $0 Planning for an aging population 0-19 20-34 35-44 45-54 55-64 65-74 75-84 85 and Above Other Retirement All Other Public Transfers
Indications from the demography: • Reduction in per capita income tax and sales tax revenues (principal sources of state, local, transportation funding) • Increasing demand for government services • Increased demand for small lot detached and attached residences, but a surplus of large-lot (7,000 sq ft+) homes • Increasing need for safer alternatives to the auto for our aging population
Transportation… Source: California Travels – Legislative Analyst, 2007
State gasoline tax has not kept pace with travel System capacity has not kept pace with growth
Freight: We’re No. 1! Source: US Department of Transportation Estimated Trade Value by Congressional District
Containers at West Coast Ports TEUs in (millions) Local Port of Oakland LA-Long Beach Ports Out-of-region 0 5 10 15 Share, west coast ports
New San Pedro Bay Forecast: • More intact movement of goods via the Panama Canal. • Development of multiple import supply chains using ports on all three coasts. • Growth in trade with regions such as Europe and Latin America that favor the East or Gulf Coast ports. • Increased competition from West Coast ports • Should Consider: • Transport cost increases related to fuel price • Narrowing of labor cost disparities
The Transloading Advantage Transloading of weekly shipments from Asia affords large retailers an 18-20% reduction in their total pipeline plus safety stock inventory compared to direct shipping. Regional & National DCs Cross-dockTransloaders 1 billion sq ft of warehouses today Where will the next ½ billion sq. ft. go?
The Port and Modal Elasticity Study found: • Inadequate landside freight capacity will strangle port • growth absent major improvements • Failure to address landside congestion will cause diversion/loss of market share, and loss of logistics jobs • Phase II analysis suggests imposition of local fees will • cause diversion Source: Gill V. Hicks Year Train Type Average Delay 206.3 minutes BNSF Freight 2016? UP Freight 196.9 minutes
Community Impacts of Freight: Grade crossing delay and noise Carcinogenic air toxics Rest of Nation 48% Extreme PM2.5 Exposure South Coast Air Basin 52%
SCAB Cases/Year due to PM2.5 * Premature Deaths 5,400 Hospitalizations 2,400 Asthma & Lower Respiratory 140,000 Symptoms Lost Work Days 980,000 Minor Restricted Activity Days 5,000,000 1999-2000 Air Quality Data Source: California Air Resources Board CARB Assessment of PM Health Effects
We are not on trajectory for timely attainment of federal AQ standards (ozone and PM2.5)
NOx pollution in Southern California and San Joaquin Valley Exceedence of critical loads of nitrogen deposition in red, where negative impacts to ecosystems occur due to excess N inputs • also contributes to: • Increased invasive plant density and production • Increased fuel load • Increased threat of fire frequency and intensity • Loss of habitat for native species • Groundwater nitrate pollution Invasive grasses carry fire University of California, Riverside Data and graphic courtesy Dr. Michael Allen, Professor and Chair, Plant Pathology and Microbiology, University of California, Riverside
Need for Zero/Near Zero Emission Technologies • Plans to date include insufficient measures to actually attain federal clean air standards • Even full fleet turnover to 2010 truck standards and to the Tier 4 locomotive standards proposed by USEPA (per the RTP) will not provide sufficient reductions • This air basin must achieve zero and near-zero emission vehicle penetration far beyond levels assumed in ARB’s EMFAC model (which is also used for SB375 GHG calculations) to attain federal health standards.
Do we attack the air quality problem in effective ways? SB 375 – 3-5% (?) reduction in GHG from changed land use patterns, new urban design, and enhanced transit
% VMT Reduction by Individual Measures, 10 yr, 20 yr, 30 yr, 40 yr From Rodier (2008), UC Berkeley for the 2009 TRB But is our approach to air quality effective? SB 375 calls for a 3-5% (?) reduction in GHG from changed land use patterns and enhanced transit
“So now we know: The price point is $4. At $3 a gallon, Americans just grin and bear it, suck it up, and, while complaining profusely, keep driving like crazy. At $4, it is a world transformed. Americans become rational creatures. Mass transit ridership is at a 50-year high. Driving is down 4 percent… Hybrids and compacts are flying off the lots. SUV sales are in free fall.” CHARLES KRAUTHAMMER, Pulitzer Prize-winning syndicated columnist, June 7, 2008
Technology? Notes 1. Based on 12,215 annual mileage. 2. Data obtained from Smog Forming Pollutants Chart, EPA Green Vehicle Guide: www.epa.gov/autoemissions/0-10chart.htm 3. Calculated using (12,215 miles / Combined MPG) x (24 pounds CO2/gallon). Includes upstream CO2 emissions and end-user CO2 emissions. David Friedman, Senior Engineer, Union of Concerned Scientists. Personal communication 7/25/2003. 4. Fuel economy rating for automatic/continuously variable transmission. 5. Assumes 55% city driving and 45% highway driving. Emission Standard Key: Vehicles meeting the Federal Tier 2 Bin 8 standard produce: 4.2 g/mi of CO, 0.02 g/mi of particulate matter, 0.2 g/mi of NOx, and 0.125 g/mi of non-methane organic gases. Vehicles meeting California’s SULEV II (Super Ultra Low Emissions Vehicle) standard produce: 1.0 g/mi of CO, 0.01 g/mi of particulate matter, 0.02 g/mi of NOx, and 0.01 g/mi of non-methane organic gases.
AIR QUALITY STRATEGIES for transportation sources More effective Clean technologies (EVs, plug-in hybrids): 90%+ reductions in emissions per vehicle Pricing (increased gas tax, VMT fees, congestion pricing): 10%+ reductions in VMT in < 5 years Land use change: possibly 4% in VMT over 20 years (per Rodier) Transit: 3%(?) in VMT over 20 years (per Rodier) Infrastructure investment: little, but critical for mobility Less effective Note: Less effective strategies (e.g. land use and transit) can be more effective if combined with pricing and clean technologies
ENERGY – an Economy Powered by Fossil Fuels Mathematical relations involved in the complete cycle of production of any exhaustible resource from Hubbert, M. King (1956), Pub. No. 95, Shell Development Co. Exploration and Production Research Division
Upstream cost of oil production Our energy outlook: petroleum Source: New York Times (2007) from US Energy Administration Data
Hubbert linearization of world production Source: The Oil Drum, Discussions About Energy and Our Future at http://www.theoildrum.com/ story/2006/1/20/193723/259
Oil production from the Majors, 1997 to 2007 Compilation by Energy Watch Group 2007
Research to Overcome the Energy Challenge? Graph courtesy of Kei Koizumi, White House Office of Science and Technology Policy
Energy Efficiency Energy produced (kinetic) per energy input (chemical or electrical) Upper efficiency limits of various technologies: • Steam/external combustion: 10% single expansion, 25% multiple • Gasoline (internal combustion): 37% • Diesel (internal combustion): 50%+ • Electric: 80 – 90%+, higher horsepowers more efficient • Electric generation: 50%+ simple, 90% with cogeneration Various sources
U.S. Fuel Economy for New Light-Duty Vehicles 230 59 percent more energy performance 2004 210 2003 2002 190 2001 2000 1999 1998 170 Horsepower 1997 1996 52 percentmore output 1995 1994 150 1993 1977 1992 1975 1991 1978 1990 1989 130 1976 1988 1979 1985 1987 1984 1980 110 1986 1983 1982 1981 0 0 14 16 18 20 22 24 12 Miles per Gallon Sources: Environmental Protection Agency; Energy Information Administration 1975–2004 Model Years Sales-Weighted Horsepower and MPG
Source: UC Berkeley International Fuel Economy Comparison Comparison of fleet average fuel economy and GHG emission standards for new-sale light-duty vehicles
Mary Peters Secretary of Transportation — Chairperson Jack SchenendorfOf Counsel, Covington & Burling — Vice Chair Frank BusalacchiWisconsin Secretary of Transportation Maria CinoDeputy Secretary of Transportation Rick Geddes Director of Undergraduate Studies, Cornell University Steve HemingerExecutive Director, Metropolitan Transportation Commission Frank McArdleGeneral Contractors Association of New York Steve OdlandChairman and CEO, Office Depot Patrick Quinn Chairman, American Trucking Association Matt Rose CEO, Burlington Northern Santa Fe Railroad Tom SkanckeCEO, The Skancke Company Paul WeyrichChairman and CEO, Free Congress Foundation
Findings of the Federal 1909 Commission • Public trans spending <$100B • Should be spending $225B • to meet long-term needs • Federal share should be • historic 40% (currently 17% • of $225B) • But failure to maintain fee-for- • use financing (eg. gas tax) will • increase cost to improve to • >$300B Current Spending(2006) Cost to Improve(2055) Cost to Maintain(2055)
What is this information in combination telling us, and how can it best be used to craft public policy? Housing Jobs/ Economy Water (Supply/Quality) Climate Change Freight Movement Land Use (Urban Form) Transportation (Moving People) Air Quality (PM, Air Toxics, Ozone) Education Energy
TAKEAWAYS: • Demography: • Reduction in average per capita income tax and sales tax revenues, increasing demand for services • Smaller labor force supporting large aging and very young populations • Need for safer transport alternatives for the aging population • Increased demand for small lot detached and attached residences, little demand for new large lot • Energy: • Petroleum production may be 60% of today’s by 2040, natural gas will decline more slowly • Significant near-term reductions in EROI from limitations on fossil fuel production • Need intense focus on development of energy alternatives • Near-term need for energy-efficient (not just fuel efficient) technologies to reduce demand • Trend toward compaction of non-residential uses driven by increasing transport costs • Transport: (people and goods) • 5 million more people to move, yet most (90%+) of our ‘future’ infrastructure is here today • Still expecting a doubling of freight in 20 years, need dedicated clean technology freight corridors • Need to maximize utility of existing infrastructure
TAKEAWAYS #2 • Air Quality: • Reductions from transport sector are key, attainment requires zero/near zero technologies, • all modes, in 1-2 decades • Fuel tax increases would help incentivize transformation • Transparency essential, no more “black boxes” • Greenhouse Gases: • Technologic transformation needed for clean air is also most direct path to reduce GHG’s • Gas tax increase and pricing measures would provide far most significant near- term result • Demographic factors and energy constraints will drive land use compaction consistent with SB375. • Transportation Finance: • Need to double annual nationwide transportation investment if only to operate and preserve system • Need to more than triple investment if fee-for-use not re-established • Gas tax increase the most obvious and technically easy first step. Would: pay to preserve , operate, improve system; reduce demand (VMT reduction = GHG & pollutant reduction); incentivize fuel efficiency and fleet transformation; promote energy independence; continue to be a viable revenue source for 10-20 years • VMT fee or similar revenue source needed within 10 years, container fees needed to fund freight
Are our plans aligned with these factors? The good news: Responses to the various challenges are remarkably synergistic