Download
1 / 17
170 likes | 344 Views
Lake Status Indicator Selection. David F. Staples Ray Valley. SLICE Goals Develop relevant indicators for measuring lake status Use indicators to detect environmental changes and their effect on aquatic communities Forecast changes to lake systems

E N D
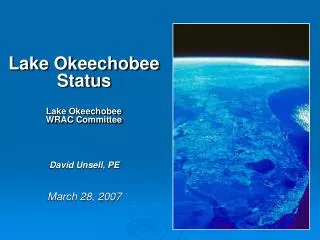
Lake Status Indicator Selection David F. Staples Ray Valley
SLICE Goals Develop relevant indicators for measuring lake status Use indicators to detect environmental changes and their effect on aquatic communities Forecast changes to lake systems Evaluate effectiveness of potential management or mitigation actions Implied Needs Indicators of lake status Framework to connect indicator measurements to lake status Means to use indicators to predict near-term lake status Means to connect indicators to specific problems or solutions → Will require a causal model connecting indicators to lake status. → Developing causal model will help in choosing status indicators → Basis for implementing adaptive management strategy
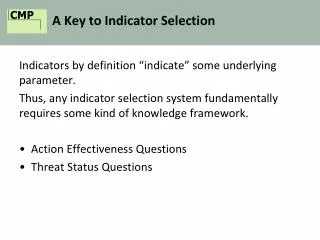
General Indicator Selection Strategy • Systematic and transparent process to find thebest set of indicators for inference on lake status at important spatiotemporal scales • Characteristics of individual indicators are important, but are secondary to whether or not the indicator set provides best inference on lake status • Utilize a causal model framework for conceptual guidance on indicator selection and interpretation. • Help facilitate a rigorous selection process to increase scientific validity of inference on lake status from indicator data. Development Regulations Riparian Buffer Zones STATE PRESSURE RESPONSE Eutrophication Community Shift Non-Permeable Surface Fertilizer runoff
Urban Development Land Non-Permeable Surfaces Drainage Patterns Nutrient Levels Streams Climate Change Nutrient/Sediment Load Hydrology Agriculture Lake Available Nutrients Society Lake Flora Development Activity Plants Algae Decomposers Economic Benefits Water Quality Lake Fauna Recreation Zooplankton Food Fish Community State
Urban Development Land Paper 1 Non-Permeable Surfaces Drainage Patterns Nutrient Levels Streams Climate Change Nutrient/Sediment Load Hydrology Agriculture Lake Available Nutrients Society Lake Flora Development Activity Plants Algae Decomposers Economic Benefits Water Quality Lake Fauna Recreation Zooplankton Food Fish Community State
Lake Stressor Ratings 2011 2012
Urban Development Land Paper 1 Non-Permeable Surfaces Drainage Patterns Nutrient Levels Streams Climate Change Nutrient/Sediment Load Hydrology Agriculture Lake Paper 2 Available Nutrients Society Lake Flora Development Activity Plants Algae Decomposers Economic Benefits Water Quality Lake Fauna Recreation Zooplankton Food Fish Community State
Key Action Items Causal lake system models -Current Knowledge, Hypotheses, Theory on lake system dynamics? -Evaluate models w/ historical and sentinel lake data, refine as understanding increases w/ new data. Define research question, or management goals for MN lakes -Is lake meeting management goals? Optimal/Preferred aquatic community? Likelihood of meeting goals in future? -Specific research question is critical for tailoring indicator set for robust inference on the status of the fishery, the crucial/integrative component of lake systems (i.e. in DNR FAW view, plus fish can be viewed as ‘ultimate’ expression of system health)
Choose indicators that address phenomenon of interest and give insight into what factors are driving changes. • (e.g. fish IBI for community status, plus Nutrient levels, plant/zoop community IBIs, non-perm indicator for inference on drivers of change in fishery community). • Also may want to choose indicators for inference on status at a variety of spatio-temporal scales • (immediate local conditions, to long-term basin outlook). • In any case, indicator selection must be tailored to answer the specific research question.
Indicator Sampling and the SPD • Want to incorporate indicator sampling in split panel design for local, regional, & statewide inference on status of MN lakes (may be current status, trends, statistical analyses, or causal modeling). • Likely have a range of sampling intensities, definition of status should be flexible enough to allow status estimation from disparate sources (while accounting for sample selection procedure and the potential biases or imprecision in any given estimate). • Intensely sampled lakes (Large lakes, sentinel lakes) • Lake survey data • Random sampling • ‘Free’ data • Can adjust effort to optimally collect information needed for management/status evaluation purposes • Utilize new sampling to test and refine causal network models (monitoring and modeling connected by management)
Disrupted hydrological regimes Increased Nutrients & Sediment Warmer water Lower Dissolved Oxygen Loss of physical structure Non-Permeable Surface Fertilizer usage Altering flow of water Warmer temps Variable precip Non-native invasion Macrophyte removal Biotic Community Shift Violation of Clean Water Act Economic Growth Population Growth Climate change STATE PRESSURE RESPONSE DRIVING FORCE IMPACT Riparian Buffers Management Intervention Development Regulations Conservation Reserve Program Outreach and education
Stressors Land Paper 1 Sediments Devel. Stressors Nutrient Levels Drainage Patterns Ag stressors Streams or surficial flow Nutrient Load Hydrology Climate Stressors Lake Paper 2 Society Available Nutrients Development Patterns Lake Flora Plants Algae Decomposers Economic Benefits Water Quality Lake Fauna Recreation Zooplankton Food Fish Community State