Download
1 / 17
170 likes | 301 Views
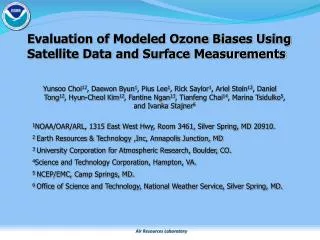
Surface UV from TOMS/OMI measurements. N. Krotkov 1 , J. Herman 2 , P.K. Bhartia 2 , A. Tanskanen 3 , A. Arola 4 Goddard Earth Sciences and Technology (GEST) Center, UMBC, Baltimore, MD Laboratory for Atmospheres, NASA GSFC, Greenbelt, MD Finnish Meteorological Institute , Helsinki, Finland

E N D
Surface UV from TOMS/OMI measurements • N. Krotkov1, J. Herman2, P.K. Bhartia2 , A. Tanskanen3 , A. Arola4 • Goddard Earth Sciences and Technology (GEST) Center, UMBC, Baltimore, MD • Laboratory for Atmospheres, NASA GSFC, Greenbelt, MD • Finnish Meteorological Institute , Helsinki, Finland • Finnish Meteorological Institute , Kuopio, Finland
OMI Science questions • Is the ozone layer recovering ? • What are sources and distributions of aerosols and trace gases that affect global air quality? • What are the roles of tropospheric ozone and aerosols in climate change? • What are the causes of surface UV-B change ? Levelt et al “ Science objectives of Ozone Monitoring Instrument “ in IEEE- TGRS AURA special issue
UV products: noon irradiance + Daily CIE dose(305nm, 310nm, 324nm, 380nm, CIE - UV index) 324nm 305nm 380nm Erythemal – UV index
Current Applications of TOMS/OMI UV data 1. Sun burn and skin cancer PHS, NIH, WHO 2. Eye cataracts PHS, NIH, WHO 3. Plant damage - Crop yields USDA 4. Food chain - Land – Oceans USDA, NOAA 5. Effect on insect population NIH, PHS, WHO
TOMS/OMI UV algorithm OMI Ozone Sun: Fo ( ~ 3% uncertainty ) Clouds and non-absorbing aerosols are well corrected Clouds Fc ~ FO3(1 – R) Absorbing aerosols are still a major problem Aerosols
Cloud correction algorithm (CT) ISCCP TOMS daily Satellite CT estimate 10 day monthly UV- Williams et al GRL 2004 (1:1) (1:1) PAR - Dye et al GRL 1995 Ground CT measurement
Clouds over snow correction • Surface albedo is a crucial parameter for estimation of the surface UV in regions with temporary snow or ice. • OMI UV algorithm applies an albedo climatology derived from the N7/TOMS reflectivity data using the moving time window method. • The accuracy of the surface UV estimates for high latitudes has improved.However, the estimates for albedo transient periods are still uncertain. http://promote.fmi.fi/MTW_www/MTW.html
The TOMS-Brewer difference for erythemally weighted UV irradiance and for UV irradiance at 305, 310, and 324 nm. Summer noon values for mostly clear sky conditions (TOMS reflectivity <0.2)
The TOMS-Brewer difference for erythemally weighted summer noon UV irradiance for mostly clear sky conditions (TOMS reflectivity <0.2) Urban locations
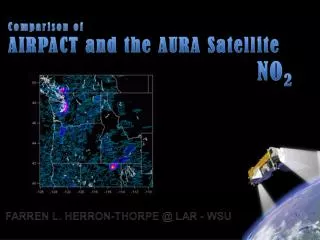
Long-range ABSORBING aerosol transport in free troposphere is uniquely tracked by OMI/TOMS Aerosol Index (AI) US AI cannot detect boundary layer UV absorbing aerosols resulting in overestimates of UV irradiance that are frequently 10% and sometimes 20%. India Southeast Asia TOMS AI examples of high-density smoke aerosols that affect various coastal regions in the US, India, and Southeast Asia. Lesser amounts of smoke, dust, and carbonaceous aerosols frequently cause overestimations of UV irradiance if ignored.
UV reduction due to absorbing aerosols in free troposphere (dust, smoke) is corrected using positive AI >0.5 data Industrial aerosols close to the ground are not seen in AI data (AI <0), so they are treated as thin clouds, which leads to positive UV bias
Ground AEROSOL absorption measurements UV Multifilter Rotating Shadowband Radiometer AERONET CIMEL sun-sky radiometers Brewer spectrometer ozone, SO2, NO2 [Cede and Herman] Since 2002, the NASA TOMS, AERONET and USDA UVB programs have shared equipment, personnel and analysis tools to quantify aerosol UV-VIS absorption using a combination of ground based radiation measurements.
TOMS UV Correction for Absorbing Aerosols in Greenbelt, USA 1 TOMS/Ground UV ABS at 325nm ABS at 325nm The ratio between satellite estimated (by TOMS UV algorithm7-10) and measured (by UVMFRSR) total (direct plus diffuse) surface UV irradiance at 325nm versus aerosol absorption optical thickness at 325nm inferred from combined UV-MFRSR and AERONET measurements at NASA/GSFC site. The line shows theoretical relationship derived from radiative transfer modeling10. Time series of aerosol absorption optical thickness tabs at 368nm, derived from 17 months UV-MFRSR operation at NASA GSFC site in Maryland, US. The data are for cloud-free and snow-free conditions and tabs(440)>0.1. Individual tabs(368) values were averaged over 1-hour period of time within ±60min of the AERONET inversion. 1Krotkov et al. Opt. Engineering 2005
TOMS UV Correction for Absorbing Aerosols in 2 urban sites 1 SZA=20-30 SZA=40-50 SZA=60-70 The ratio of TOMS to Brewer irradiance at 324nm against aerosol absorption optical thickness in Thessaloniki, Greece The ratio of TOMS to Brewer irradiance at 324nm against aerosol absorption optical thickness at Ispra, Italy 1Arola et al. accepted JGR 2005
Future Applications of OMI data 1. Global mapping of PAR (400-700nm) 2. Actinic flux profile and J-rates for photochemistry models3. UV irradiance on tilted surfaces 4. Global mapping of underwater UV-PAR irradiance 5. Global primary production estimates 6. Global carbon cycle models