Download

1 / 15
200 likes | 679 Views
Cell proliferation assay versus cell viability assays. Lecture 4. Assays Based on Cell Proliferation. Cell counts can be used to determine the effect of various compounds on cell proliferation, but at least in the early stages of testing, a complete growth curve is required. Growth Cycle:

E N D
Cell proliferation assay versus cell viability assays Lecture 4
Assays Based on Cell Proliferation • Cell counts can be used to determine the effect of various compounds on cell proliferation, but at least in the early stages of testing, a complete growth curve is required. • Growth Cycle: • After subculture, cells progress through a characteristic growth pattern of lag phase, exponential, or log phase, and stationary, or plateau phase. • population doubling time (PDT) during exponential growth • The maximum cell density achieved in the plateau phase
Why do we need PDT? • To quantify the response of the cells to different inhibitory orstimulatory culture conditions. • To monitor of the culture during serial passage and enablesthe calculation of cell yields and the dilution factor requiredat subculture.
The PDT derived from a growth curve should not beconfused with the cell cycle or generation time- what are the differences? • The cell cycle time is measured from one point in the cell cycleuntil the same point is reached again. • PDT is an average figure
PDTs vary : • 12 to 15 h in rapidly growing mouse leukemias, • 24 to 36 h in many adherent continuous cell lines • 60 or 72 h in finite cell lines. • Some cell lines have even slower rate.
Analysis of Monolayer Growth Curves • (1) Calculate the number of cells per well and cells /ml • (2) Plot the cell density (cells/cm2) and the cell concentration(cells/mL), both on a log scale, against time on a linearscale • (3) Determine the lag time, PDT, and plateau density • (4) Establish the appropriate starting density for routine passage . Repeat the growth curve at different cell concentrations if necessary • Compare growth curves under different conditions, and try to interpret the data
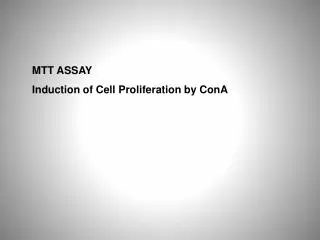
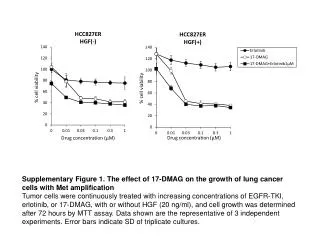
MTT • In cases where there are many samples, a single point in time—such as the number of cells three to five days after exposure—can be used. The time should be selected as within the log phase, and preferably mid-log phase, of control cells. • The most popular are 96-well microtitration plates or icroplates,each well having 28 to 32 mm2 of growth area, 0.1 or 0.2 mL medium, and up to 1 × 10⁵ cells.
MTT is a yellow water-soluble tetrazolium dye that is reduced by live, but not dead, cells to a purple formazan product that is insoluble in aqueous solutions. • This cellular reduction involves the pyridine nucleotide cofactors NADH and NADPH (36). The formazan crystals formed are solubilized and the resulting colored solution is quantified using a scanning multiwell spectrophotometer (ELISA reader).
AJ-5 Anti-proliferative effect MTT Assay MCF12A,MCF7,MDA-MB-231, FG0 and DNB cells Plate cells in 96 microplates 48 hours settle Perform a dose curve of AJ-5 For 48 hours IC50 (µM) Add MTT solutions and read over night DNB = 0.4631 FG0= 0.4049 MCF7 = 0.17 CT-1= 0.4296 MDA-MB-231 = 0.19 AJ-5 exerts potent anti-proliferative activities against human breast cancer cells