Download
1 / 1

E N D
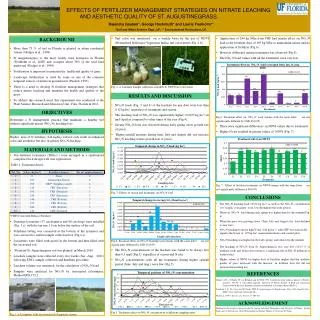
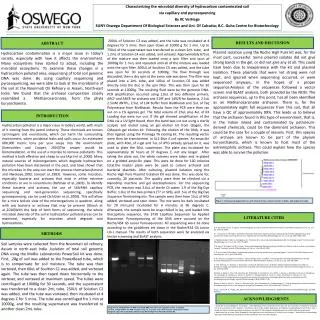
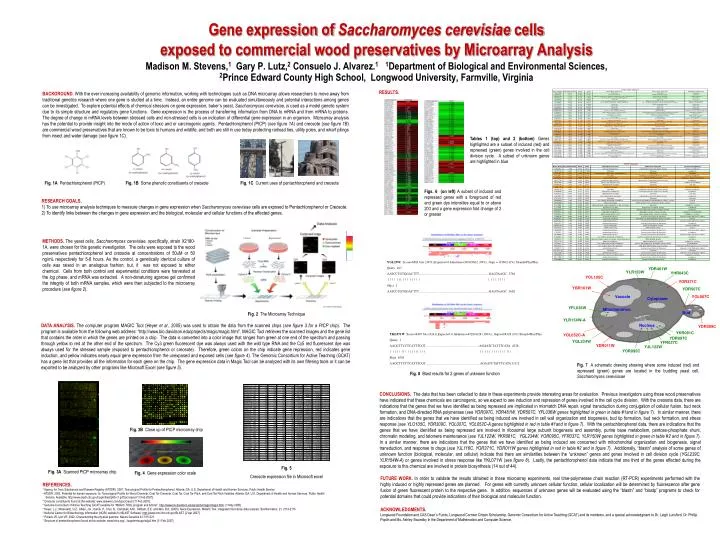
BACKGROUND.With the ever increasing availability of genomic information, working with technologies such as DNA microarray allows researchers to move away from traditional genetics research where one gene is studied at a time. Instead, an entire genome can be evaluated simultaneously and potential interactions among genes can be investigated. To explore potential effects of chemical stressors on gene expression, baker’s yeast, Saccharomyces cerevisiae, is used as a model genetic system due to its simple structure and regulatory gene functions. Gene expression is the process of transferring information from DNA to mRNA and from mRNA to proteins. The degree of change in mRNA levels between stressed cells and non-stressed cells is an indication of differential gene expression in an organism. Microarray analysis has the potential to provide insight into the mode of action of toxic and or carcinogenic agents. Pentachlorophenol (PtCP) (see figure 1A) and creosote (see figure 1B) are commercial wood preservatives that are known to be toxic to humans and wildlife, and both are still in use today protecting railroad ties, utility poles, and wharf pilings from insect and water damage (see figure 1C). Fig. 1A Pentachlorophenol (PtCP) Fig. 1B Some phenolic constituents of creosote Fig. 1C Current uses of pentachlorophenol and creosote RESEARCH GOALS. 1) To use microarray analysis techniques to measure changes in gene expression when Saccharomyces cerevisiae cells are exposed to Pentachlorophenol or Creosote. 2) To identify links between the changes in gene expression and the biological, molecular and cellular functions of the effected genes. METHODS.The yeast cells, Saccharomyces cerevisiae, specifically, strain X2180-1A, were chosen for this genetic investigation. The cells were exposed to the wood preservatives pentachlorophenol and creosote at concentrations of 50uM or 50 ng/mL respectively for 5-6 hours. As the control, a genetically identical culture of cells was raised in an analogous fashion; but, it was not exposed to either chemical. Cells from both control and experimental conditions were harvested at the log phase, and mRNA was extracted. A non-denaturing agarose gel confirmed the integrity of both mRNA samples, which were then subjected to the microarray procedure (see figure 2). Fig. 2 The Microarray Technique DATA ANALYSIS.The computer program MAGIC Tool (Heyer et al., 2005) was used to obtain the data from the scanned chips (see figure 3 for a PtCP chip). The program is available from the following web address: “http://www.bio.davidson.edu/projects/magic/magic.html”. MAGIC Tool retrieves the scanned images and the gene list that contains the order in which the genes are printed on a chip. The data is converted into a color image that ranges from green at one end of the spectrum and passing through yellow to red at the other end of the spectrum. The Cy3 green fluorescent dye was always used with the wild type RNA and the Cy5 red fluorescent dye was always used for the stressed sample (exposed to pentachlorophenol or creosote). Therefore, green colors on the chip indicate gene repression, red indicates gene induction, and yellow indicates nearly equal gene expression from the unexposed and exposed cells (see figure 4). The Genomic Consortium for Active Teaching (GCAT) has a gene list that provides all the information for each gene on the chip. The gene expression data in Magic Tool can be analyzed with its own filtering tools or it can be exported to be analyzed by other programs like Microsoft Excel (see figure 5). YDR461W YLR150W YHR043C YOL105C YOR371C YBR161W YDR507C Cytoplasm Vacuole YOL007C Vacuole Cytoplasm YFL036W Mitochondrion Mitochondrion Bud YLR154W-A Nucleus YDR309C YKR081C YOL052C-A YDR097C YGL234W YFR037C YDR011W YJL122W YOR095C Control Experimental Gene expression of Saccharomyces cerevisiae cells exposed to commercial wood preservatives by Microarray Analysis RESULTS. Tables 1 (top) and 2 (bottom) Genes highlighted are a subset of induced (red) and repressed (green) genes involved in the cell division cycle. A subset of unknown genes are highlighted in blue Figs. 6(on left) A subset of induced and repressed genes with a foreground of red and green dye intensities equal to or above 200 and a gene expression fold change of 2 or greater YGL239C Score=6881 bits (3471),Expect=0.0 Identities=3600/3602 (99%), Gaps = 0/3602 (0%) Strand=Plus/Plus Query 163 AATCCTGTGGACTTT………………………………………………………..GAGTAAGC 3764 | | | | | | | | | | | | | | | | | | | | | | | Sbjct 1 AATCCTGTGGACTTT………………………………………………………..GAGTAAGC 3602 Madison M. Stevens,1 Gary P. Lutz,2 Consuelo J. Alvarez.11Department of Biological and Environmental Sciences, 2Prince Edward County High School, Longwood University, Farmville, Virginia YKL071W Score=8407 bits (4241),Expect=0.0 Identities=4328/4328 (100%), Gaps=0/4328 (0%) Strand=Plus/Plus Query 1 AAGCTTCCTCATTTCGT…………………………………………..AGAATCTATTTCATA 4328 | | | | | | | | | | | | | | | | | | | | | | | | | | | | | | | | Sbjct 6785 AAGCTTCCTCATTTCGT………………………………………….. AGAATCTATTTCATA 11112 Fig. 7 A schematic drawing showing where some induced (red) and repressed (green) genes are located in the budding yeast cell, Saccharomyces cerevisisae Fig. 8 Blast results for 2 genes of unknown function CONCLUSIONS. The data that has been collected to date in these experiments provide interesting areas for evaluation. Previous investigators using these wood preservatives have indicated that these chemicals are carcinogenic, so we expect to see induction and repression of genes involved in the cell cycle division. With the creosote data, there are indications that the genes that we have identified as being repressed are implicated in mismatch DNA repair, signal transduction during conjugation of cellular fusion, bud neck formation, and DNA-directed RNA polymerase (see YDR097C, YDR461W, YDR507C, YFL036W genes highlighted in green in table #1and in figure 7). In similar manner, there are indications that the genes that we have identified as being induced are involved in cell wall organization and biogenesis, bud tip formation, bud neck formation, and stress response (see YLO105C, YDR309C, YOL007C, YOL052C-A genes highlighted in red in table #1and in figure 7). With the pentachlorophenol data, there are indications that the genes that we have identified as being repressed are involved in ribosomal large subunit biogenesis and assembly, purine base metabolism, pentose-phosphate shunt, chromatin modeling, and telomere maintenance (see YJL122W, YKR081C, YGL234W, YOR095C, YFR037C, YLR150W genes highlighted in green in table #2 and in figure 7). In a similar manner, there are indications that the genes that we have identified as being induced are concerned with mitochondrial organization and biogenesis, signal transduction, and response to drugs (see YJL116C, YOR371C, YDR011W genes highlighted in red in table #2 and in figure 7). Additionally, “blastn” analysis of some genes of unknown function (biological, molecular, and cellular) indicate that there are similarities between the “unknown” genes and genes involved in cell division cycle (YGL239C, YLR154W-A) or genes involved in stress response like YKL071W (see figure 8). Lastly, the pentachlorophenol data indicate that one third of the genes effected during the exposure to this chemical are involved in protein biosynthesis (14 out of 44). Fig. 3B Close up of PtCP microarray chip Fig. 5 Creosote expression file in Microsoft excel Fig. 3A Scanned PtCP microarray chip Fig. 4 Gene expression color scale FUTURE WORK.In order to validate the results obtained in these microarray experiments, real time-polymerase chain reaction (RT-PCR) experiments performed with the highly induced or highly repressed genes are planned. For genes with currently unknown cellular function, cellular localization will be determined by fluorescence after gene fusion of green fluorescent protein to the respective gene. In addition, sequences of unknown genes will be evaluated using the “blastn” and “blastp” programs to check for potential domains that could provide indications of their biological and molecular function. • REFERENCES. • * Agency for Toxic Substances and Disease Registry (ATSDR). 2001. Toxicological Profile for Pentachlorophenol. Atlanta, GA: U.S. Department of Health and Human Services, Public Health Service. • ATSDR. 2002. Potential for human exposure. In: Toxicological Profile for Wood Creosote, Coat Tar Creosote, Coal Tar, Coal Tar Pitch, and Coal Tar Pitch Volatiles. Atlanta, GA: U.S. Department of Health and Human Services, Public Health • Service. Available: http://www.atsdr.cdc.gov/toxprofiles/tp85-c1.pdf [accessed 11 Feb 2007]. • * Creosote constituents found at this website: www.answers.com/topic/cresol [11 Feb 2007]. • * Genome Consortium of Active Teaching (GCAT) website for “MAGIC TOOL program and tutorial”. http://www.bio.davidson.edu/projects/magic/magic.html. [1 May 2005]. • * Heyer, L.J., Moskowitz, D.Z., Abele, J.A., Karnik, P., Choi, D., Campbell, A.M., Oldham, E.E. and Akin, B.K. (2005). Gene Expression. MAGIC Tool: integrated microarray data analysis. Bioinformatics. 21, 2114-2115. • * National Center for Biotechnology Information (NCBI) website for BLAST Software. http://www.ncbi.nlm.nih.gov/BLAST. [2 Apr 2007]. • * Pollack JR, Iyer VR. 2002. Characterizing the physical genome. Nature Genetics 32: 515-521. • * Structure of pentachlorophenol found at this website: www.intox.org/.../supplem/supp/su[p2.htm[11 Feb 2007]. ACKNOWLEDGMENTS. Longwood Foundation and CAS Dean’s Funds, Longwood Cormier Citizen Scholarship, Genomic Consortium for Active Teaching (GCAT) and its members, and a special acknowledgment to Dr. Leigh Lunsford, Dr. Phillip Poplin and Ms. Ashley Swandby in the Department of Mathematics and Computer Science.