Download
1 / 10
100 likes | 113 Views
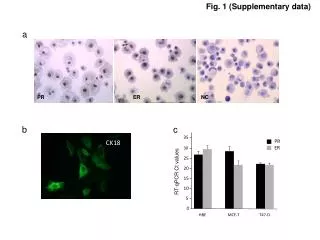
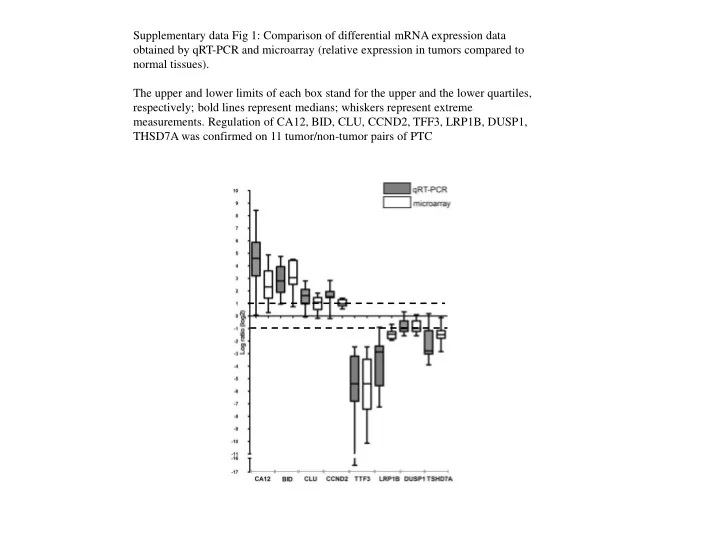
Supplementary data Fig 1: Comparison of differential mRNA expression data obtained by qRT-PCR and microarray (relative expression in tumors compared to normal tissues) .

E N D
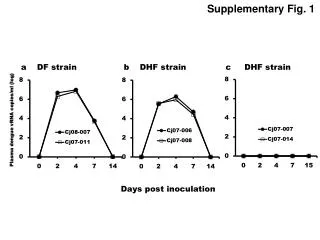
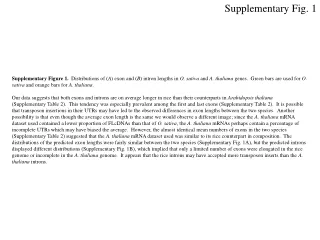
Supplementary data Fig 1: Comparison of differential mRNA expression data obtained by qRT-PCR and microarray (relative expression in tumors compared to normal tissues). The upper and lower limits of each box stand for the upper and the lower quartiles, respectively; bold lines represent medians; whiskers represent extreme measurements. Regulation of CA12, BID, CLU, CCND2, TFF3, LRP1B, DUSP1, THSD7A was confirmed on 11 tumor/non-tumor pairs of PTC
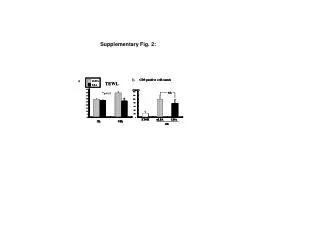
Supplementary data Fig 2 Median age at operation in the exposed and non exposed samples p = 0.006 Age at aperation Exposed Non exposed
Supplementary data Figure 3 Hierarchical Clustering (pearson correlation, pairwise average-linkage) (Gene Pattern) on the basis of all probes after age-adjustment; Arrows point the exposed tissues
Supplementary data Fig 4: Enrichment plot of the gene signature identified by SAM in the Polish data set of normal exposed and non exposed thyroid tissues
Supplementary Table 1: Patient information, clinical data and gene alterations for the PTC samples used for microarray analyses.
Suppl. Table 1 (continued): The PTCs were characterized for the presence of RET/PTC rearrangements and for the most frequent BRAF mutation, V600E, via DNA direct sequencing (details in ref. 3). Expression of the RET gene was classified as balanced (BAL) when expression of the extracellular domain (EC) and tyrosine kinase domain (TK) were the same, as unbalanced TK when the expression of the TK was significantly higher than expression of the EC domain, as unbalanced EC when the EC domain was more highly expressed compared with expression of the TK domain, and as nonRET expressor (nre) when no expression, or very low expression, of both domains was detectable. NA= not available, F = female, M = male, tbno = Chernobyl Tissue Bank number, age op = age at operation; Subtypes: P = papillary, F = follicular variant, S = solid. TNM = tumor node metatstasis status according to classification of malignant tumors of UICC (Union for International Cancer Control)
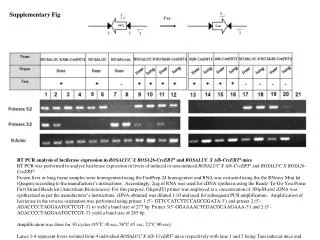
Supplementary data Table 2: Sequences of the primers used for real-time RT-PCR (fwd: forward, rev: reverse)
Supplementary data Table 4: molecular functions of gene ontology categories enriched in exposed normal tissues and statistical signifiance following the analysis of the 793 probes discriminating normal non exposed/exposed tissues with DAVID software
Supplementary data Table 5: GSEA analysis with previously published radiation signatures (11-13,40): class phenotypes: normal non exposed versus normal exposed tissues (Metric for ranking genes: signal to noise). DNA repair signatures: NER, NER-RELATED, BER, MMR, HR, NHEJ: Wood R et al 2005: Human DNA repair genes. Mutation Research 577: 275–283.