Download
1 / 29
290 likes | 378 Views
The U.S. Drought Monitor and Beyond. Mark Svoboda, Mike Hayes National Drought Mitigation Center University of Nebraska-Lincoln. Scoping Workshop for the Upper Colorado Basin NIDIS Pilot Boulder, CO October 1-2, 2008. 1997: WDCC MAP WCWS. Evolution………………. 1998: NDMC Drought Impact

E N D
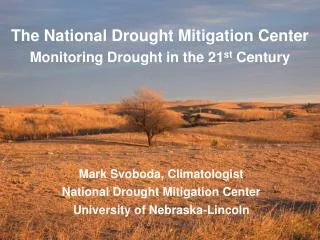
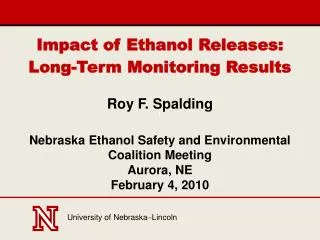
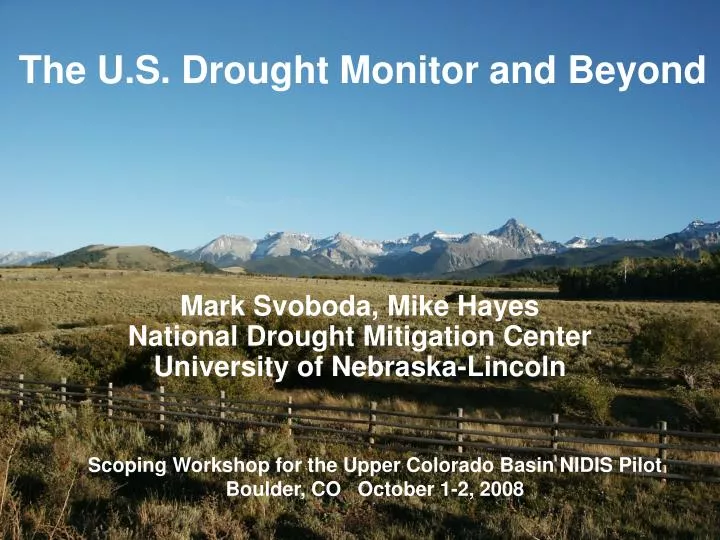
The U.S. Drought Monitor and Beyond Mark Svoboda, Mike Hayes National Drought Mitigation Center University of Nebraska-Lincoln Scoping Workshop for the Upper Colorado Basin NIDIS Pilot Boulder, CO October 1-2, 2008
1997: WDCC MAP WCWS Evolution……………… 1998: NDMC Drought Impact Monitoring product
1999:The U.S. Drought Monitor Since 1999, NOAA (CPC and NCDC), USDA, and the NDMC have produced a weekly composite drought map -- the U.S. Drought Monitor -- with input from numerous federal and non-federal agencies
Approaches to Drought Assessment Single index or Indicator (parameter) Multiple indices or Indicators Composite Indicator
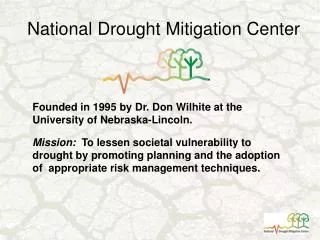
The Drought Monitor Concept • A partnership between the NDMC, USDA and NOAA’s CPC and NCDC (authors) • Incorporate relevant information and products from all entities (and levels of government) dealing with drought (RCC’s, SC’s, federal/state agencies, etc.) (experts) • The Drought Monitor provides a general up-to-date summary of current drought conditions across the 50 states, Puerto Rico and the Pacific possessions (updated weekly)
Original Objectives • “Fujita-like” scale • NOT a forecast! • NOT a drought declaration! • Identify impacts (A, H) • Assessment of current conditions • Incorporate local expert input • Be as objective as possible
The Drought Monitor Concept • A consolidation of indices and indicators into one comprehensive national drought map • Trying to capture these characteristics: • the drought’s magnitude (duration + intensity) • spatial extent • probability of occurrence • Impacts • Rates drought intensity by percentile ranks
U.S. Drought Monitor Map Drought Intensity Categories D0 Abnormally Dry (30%tile) D1 Drought – Moderate (20%tile) D2 Drought – Severe (10%tile) D3 Drought – Extreme (5%tile) D4 Drought – Exceptional (2%tile)
U.S. Drought Monitor Integrates Key Drought Indicators: - Palmer Drought Index - SPI - KBDI • Modeled Soil Moisture - 7-Day Avg. Streamflow - Precipitation Anomalies Growing Season: - Crop Moisture Index - Sat. Veg. Health Index • Soil Moisture • Mesonet data In The West: - SWSI - Reservoir levels • Snowpack • Streamflow Created in ArcGIS
Some Examples of Decision Making Using the DM • USDA Dried Milk Program • USDA CRP Release hot spot trigger • Numerous states use as a drought trigger (Governor’s declarations) • USDA Livestock Assistance • IRS (tax deferral on livestock losses) • 2008 Farm Bill • NWS Drought Information Statements (DGTs)