Download
1 / 11
110 likes | 129 Views
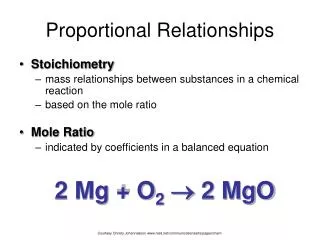
Proportional Relationships and Graphs. 2.3. How can you use graphs to represent and analyze proportional relationships?. Texas Essential Knowledge and Skills. The student is expected to:. Proportionality—7.4.A. Represent constant rates of change in mathematical and real-world problems

E N D
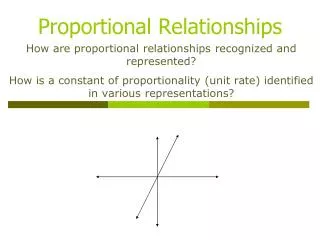
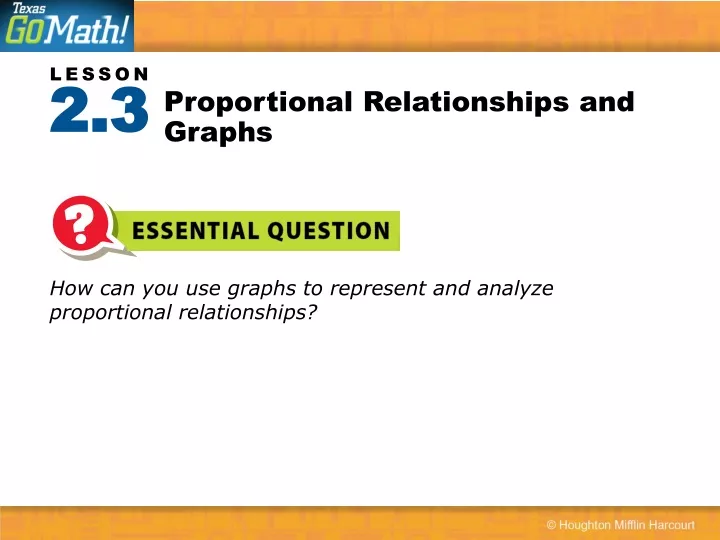
Proportional Relationships and Graphs 2.3 How can you use graphs to represent and analyze proportional relationships?
Texas Essential Knowledge and Skills The student is expected to: Proportionality—7.4.A Represent constant rates of change in mathematical and real-world problems given pictorial, tabular, verbal, numeric, graphical, and algebraic representations, including d = rt. Proportionality—7.4.C Determine the constant of proportionality within mathematical and real-world problems. Proportionality—7.4.D Solve problems involving ratios, rates, and percents, including multi-step problems involving percent increase and percent decrease, and financial literacy problems.
Texas Essential Knowledge and Skills 7.1.D Communicate mathematical ideas, reasoning, and their implications using multiple representations, including symbols, diagrams, graphs, and language as appropriate. Mathematical Processes The student is expected to:
ADDITIONAL EXAMPLE 1 A test car went 64 miles on 2 gallons in the morning, 16 miles on gallon at noon, and 32 miles on 1 gallon at 5 pm. Is the relationship a proportional relationship? The graph of the data is a line that goes through the origin. So, the relationship is proportional.
ADDITIONAL EXAMPLE 2 The graph shows the relationship between the number of concert tickets purchased and the total cost for the tickets. Write an equation for this relationship. y = 20x
2.3 LESSON QUIZ The following data was collected on a cheetah. It ran mile in min, mile in min, and mile in 1 min. 7.4.A 1. Explain how you know that this is a proportional relationship. The ratio of each data set simplifies to 0.75. 2. Identify the constant of proportionality, and write an equation for the proportional relationship. 0.75; y = 0.75x
The following data was collected on a cheetah. It ran mile in min, mile in min, and mile in 1 min. 3. Make a table and a graph of the proportional relationship.
The following data was collected on a cheetah. It ran mile in min, mile in min, and mile in 1 min. 4. Identify a point on the graph that gives the constant of proportionality as the y-coordinate. (1, 0.75)
The graph shows one point on the graph of a proportional relationship. Use the graph labels and what you have learned about proportional relationships to describe a possible proportional relationship that it represents, and identify the constant of proportionality. Then write an algebraic equation for the proportional relationship.
The point (5, 1) is graphed. This represents 1 mile in 5 minutes, or a unit rate of mile per minute. The constant of proportionality is and an equation for the proportional relationship is y = x.
How can you use graphs to represent and analyze proportional relationships? Sample answer: A graph that is a line through the origin shows a proportional relationship.