Download
1 / 8
80 likes | 359 Views
Proportional Relationships and Graphs. Warm Up. A test car went 64 miles on 2 gallons of gas in the morning, 16 miles on ½ gallon at noon, and 32 miles on 1 gallon at 5 pm. Is the relationship a proportional relationship?.

E N D
Warm Up A test car went 64 miles on 2 gallons of gas in the morning, 16 miles on ½ gallon at noon, and 32 miles on 1 gallon at 5 pm. Is the relationship a proportional relationship?
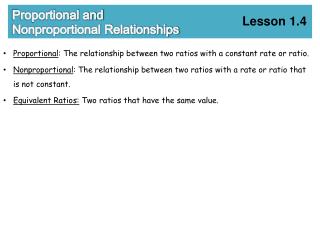
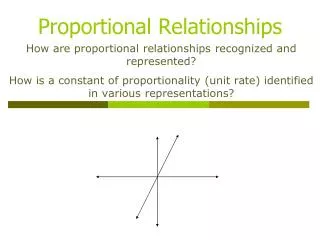
A graph shows a proportional relationship when the graph is a straight line that goes through the origin, (0, 0). Both conditions must be met.
For each situation, tell whether the relationship is a proportional relationship. Explain why or why not.
Tell whether the relationship is a proportional relationship. Explain why or why not.
Write an equation of the form y=kx for the relationship shown in each graph.
Exit Ticket The following data was collected on a cheetah. It ran ½ mile in 2/3 minute, ¼ mile in 1/3 minute, and ¾ mile in 1 minute.
Exit Ticket • Explain how you know that this is a proportional relationship. • Identify the constant of proportionality and write an equation for the proportional relationship. • Make a table and a graph of the proportional relationship. • Identify a point on the graph that gives the constant of proportionality as the y-coordinate.