Download
1 / 44
440 likes | 547 Views
Economic Complexity and Economic Development. Cesar A. Hidalgo Center for International Development, and Harvard Kennedy School Harvard University. Hidalgo CA, Hausmann R, PNAS 2009 Hidalgo CA et al., Science, 2007. Essentialist. Population Thinker. Variation. Unique. Variation.

E N D
Economic Complexity and Economic Development Cesar A. Hidalgo Center for International Development, and Harvard Kennedy School Harvard University Hidalgo CA, Hausmann R, PNAS 2009 Hidalgo CA et al., Science, 2007
Essentialist Population Thinker Variation Unique Variation Unique Essence Abstraction Variation Unique Charles Darwin and Alfred Russel Wallace Jean-Baptiste Lamarck and Carl Linnaeus
To make a product you need more than Capital and Labor Public Inputs Tradable Inputs Certifying Body Roads Trade Agreements Leather Technical Education Tanner Ports Power Labor Skills Leather Cutters Tax Regulation Norms Leather Pressers trust Sawing teamwork Sole Making Manufacturing & Management Certifications Shapers Private Inputs
Countries Capabilities Products
Countries Products
Here I will show that within this view it is possible to: -Understand and measurethe complexity of countries economies (understood as the relative number of economic activities that exist within it). -Demonstrate that economic complexity is a fundamental determinant of income. -Describe how a country’s economy developand show that this evolution is compatible only with a disaggregate view of the world. -Rephrase the question of economic integration as a question of learning in a world in which economic development is path dependent, complementing conceptualizations of trade that only emphasize gains in efficiency coming from reassignment of production /tasks. MEASURE UNDERSTAND DESCRIBE/STRATEGIZE RE-THINK INTEGRATION
1 Measure (the relative number of capabilities in a country)
1.- A Country 3.- Can make many products 2.- with a greatdiversity of Legos(capabilities)
In Network Language Simple and and and and Complex = =
kc,0 kc,1 kc,2 Simple Complex
(Year 2000) Data by Feenstra 129 countries 772 products (SITC-4) How common are those Lego models(Average Ubiquity of a Country’s Products/average Number of countries that alse makes the products you make ) kc,1 kc,0 Number of Lego Models That You Make (Diversification of a country/Number of Products a country makes) Hidalgo, Hausmann (2009)PNAS 106(26):10570-10575
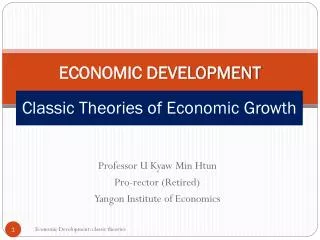
2 understand
kc,0 kc,1 kc,2 Simple Complex Hidalgo, Hausmann (2009) PNAS
Countries approach a level of income which is determined by the complexity of their economies!!! Complexity in 1985 (Controlling for GDP per capita at ppp) Hidalgo, Hausmann (2009) PNAS 106(26):10570-10575
2.5 connect(with current matters…)
Countries before the Financial Crisis Countries with an Income that “cannot” be sustained by the complexity of their economies R2=64% Countries with ample room to grow Data for 2005, Source Bacii Dataset from Cepii. Products disaggregated in HS-6 (5109 product categories)
3 describe How do countries accumulate capabilities?
CA Hidalgo, B Klinger, A-L Barabasi, R Hausmann.Science (2007)
Hidalgo et a. Science (2007) Patterns of Comparative Advantage
If I am a country: If I am a firm
4 re-think growth
Why is trade/oppennes beneficial? Gains from trade If we can all do everything, but we are not equally good at doing each individual thing… then we will always benefit from trading… But, what if we do not know how to do everything? What If it is not justa problem of more efficiently redistributing work?!!!! If the problem of development is that of accumulating capabilities.. And production depends on the existence of a diverse set of complementary economic activities .. Then how does a country acquire this individual capabilities, and their complements? Can countries learn from their trade partners?… Do countries learn from their neighbors? Could the .. Gains from Trade come from Learning,rather than redistributive gains in efficiency?
FACT: Countriestend to have productive Structure that are Similar to that of their neighbors Can this be explained by induction? Do capabilities spread Geographically? Two predictions of induction are: 1.- Geographical range of production will form clusters that will grow at the borders. 2.- Similarity between countries will grow with integration.
EVIDENCE 1: The production of some products tends to diffuse geographically!!! Dresses of woven textile fabrics Exported product in 1970’s Started exporting 1980’s Started exporting in 1990’s
EVIDENCE 1: The production of some products tends to diffuse geographically!!! Sesame Seeds Exported product in 1970’s Started exporting 1980’s Started exporting in 1990’s
LITHUANIA ENTERED THE EU IN 2004 Similarity between LTU and DEU
Over Time the productive structures of JAPAN AND KOREA have grown to be very similar Similarity between JPN and KOR
Good with added value Material 2 Process 2 Capability Expansion Good with more added value Process 1 Good with added value Material 2 Input-Output Expansion Finish Wood
from the: Center for International DevelopmentCID, Harvard Univeristy Thanks!(info @ www.chidalgo.com,or google “cesar hidalgo”)Hidalgo et al. Science (2007)Hidalgo Hausmann, Development Alternatives (2008)Hidalgo Hausmann, PNAS (2009) Cesar A. Hidalgo, Research Fellow, Center for International Development, Harvard UniversityAdjunct Lecturer in Public Policy, Harvard Kennedy School Ricardo Hausmann, Director, Center for International Development, Harvard UniversityProfessor of the Practice of Economic Development, Harvard Kennedy School