Download
1 / 45
450 likes | 515 Views
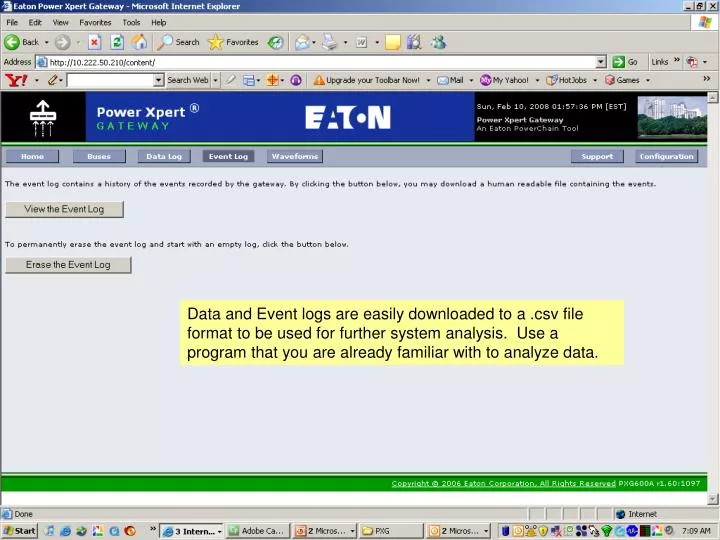
Data and Event logs are easily downloaded to a .csv file format to be used for further system analysis. Use a program that you are already familiar with to analyze data.

E N D
Data and Event logs are easily downloaded to a .csv file format to be used for further system analysis. Use a program that you are already familiar with to analyze data.
Waveforms will be deleted in the FIFO manor after exceeding 300 waveforms. The counter enhances proactive management of the files.
Select the parameter, then set the limit and message you desire.
Once the parameter is set, you can then see it in the list of Enabled Events on the device configuration page.
The PXG supports over 60 devices out-of-the-box. Additional devices can be supported with the addition of an EDS file, simply uploaded via this screen.
The PXG will email Event information, log files or a periodic “heartbeat” notification. Select up to 10 users to receive email notifications.
Power Xpert Software Simple device connectivity for Eaton equipment Easy system navigation Intuitive alarm management and email notification Customized User Views to resemble actual building layout Extensive trending of historical data 3rd party device support tools
Web Flexible, But Secure System • Secure Socket, Triple DES communication • Approved by Homeland Security • Challenge Password for each of 5 layers of authorization • Admin-Full access • Root-View only • Alarm-View & Manage Alarms • Channel Property-View & Change Alarm Properties • Control-View & Control Settings • Active Directory, allows flow through authentication • Enterprise System-2K to 250K channels • Industry standard Microsoft SQL database
Expert System • Internet Explorer Browser • A virtual site of enterprise is created that represents the actual site location and floor plan. • Navigation through a simple point and click drill down paradigm. • Equipment views show the specific device, current status and data readings. • Green, Yellow, Red, color utilization makes it easy to determine current state of each site, device or data point.
Easy System Navigation Point and click navigation Tree-view or full screen graphics with hyper links. Alarm colors bubble-up to top level view to see changes in equipment status.
Alarm summary information in web page header at all times. Standard colors to differentiate alarm states Global Acknowledge and Close capability Intuitive Alarm Management
Easily view the alarms and events based on the limits you set Detailed descriptions and functionality Well defined operational tasks Millisecond time accuracy logging Ability to print and export the alarms and events data
Event Notification and Management Event can be sent viaEmail to smart phonesor to conventional cell phoneswith email accountseg: 123456789@att.com • Even Notification Features: • Call escalation • Selected alarms to selected pages • Group Notification lists Wireless PDA support allows customers to receive and acknowledge active alarms.
Customized Views • The PXS Layout Manager module allows a user to design a look and feel that is familiar to the user as well as designing interactive floor plans with changing elements to visually identify system operations
High performance, easy to use, Web based trending Trend Display Chart or Data option Mix and match Multiple trends at one time Multiple axis supported Fixed or custom time frames Export results to Excel Data Trending for Analysis
Historical Data – Proactive Management Multi-Channel Graphing Graphs set-up by menus Min, Max, Mean, Median, Auto Statistical Analysis Auto Trending Analysis Pro-Graph for trends Burst Graphing Quick zoom feature Capacity Planning Load balancing Power Density Analysis Energy Usage Device Loading Analysis Thermo-Mapping Event Correlation Proactive Maintenance Yr/Yr Comparisons Equipment Testing
Integrated Power Quality Diagnostics Waveform Analysis Sequence of Events Harmonic Analysis Phasor Diagrams ITIC Curves
3rd Party Device Support Tools Connectors – Customized integration of any IP enabled Ethernet-ready device that provides either: SNMP – MIB File reference & IP Address Modbus/TCP – Register Map & IP Address
System Architecture Web Browser CRACs TCP/IP LAN, VPNMODEM {Can be local or remote} Device Server Power Quality Meters/SER UPS Device Server Foreseer Server PDUs Digital & Analog {Can be local or remote} DAT
Completely Scalable Architecture From single location datacenters To international Enterprises The System’s scalable technology can provide management of these critical sites locally or Enterprise wide It can grow over time without stranding hardware or software cost!
Global Enterprise Architecture GLOBAL N.O.C. Mirrored Redundancy EOC Only Client Austin E-Server Houston E-Server TCP/IP LAN WAN VPN Atlanta Only Viewing Burwood Server Atlanta DAE European Viewing Englewood DM Facility Manager’s Internet Explorer @Home Chicago Server Lafayette DM Other Sites
A user experience tailored to your needs • Enterprise-level views are created that represent the actual site location and floor plan. • Navigation through a simple point and click drill down paradigm. • Equipment views show the specific device, current status and data readings. • Green, Yellow, Red, color utilization makes it easy to determine current state of each site, device or data point.
Power Xpert Reporting Software • Standard Report Templates • Uses SQL Server Professional Reporting Services • Compatible with both Power Xpert Professional and Foreseer software • Customized reporting hierarchy to resemble actual user views of the system • Scheduled or manual execution • PDF, XML, or .CSV formats
Basic Report: Capacity Report Select Date Range and Locations Summary of top and bottom loaded circuits Detail on loading on each circuit
Basic Report: Branch Circuit Monitoring Select Date Range and Locations Capacity report with understanding of redundant sources. Color coded display shows circuit loading against capacity.
Basic Report: Energy Summary Select Date Range and Locations Energy usage and peak demand provided for locations Summary ordrill down
Basic Report: Cost Allocation Select Date Range and Locations Users enters either total cost or rate Costs are allocated by location
Basic Report: Power Quality Select Date Range and Locations See distribution and trend for any PQ variable. Click to see table with full detail
Basic Report: Event Summary Select Date Range and Locations Pareto of Events Time line and count of events by time period List of events by count
Basic Report: JCAHO Special report uses logged events to select start/end times of load test Report then displays trends for critical load parameters. Requires systems integration to ensure proper events and parameters are connected.
Real Time Power Analytics • Models electrical designs for: • Advanced Power Flow • Short Circuit Analysis • Arc Flash & more • Any variance of more than 3% from design criteria is instantly reported on • Blackboard simulation capable
Power Systems Modeling Modeling Engine • Accurately Analyzes & Prevents Problems: • Analytics Based on a Solid Foundation - The Expert Design • Demystifies Massive Amounts of Data by: • Normalizing Disparate Systems • Organizing the Information • Instantly Analyzing and Predicting • Notifying & Instructing the right people, at the Right Time • Provides off line Blackboard for “What if simulations • Much More than Monitoring – Electrical “Network” Management
Contact Info Steve Van DuserPower Management Marketing Manager Southeast RegionEaton Corporation8380 Capital BlvdRaleigh, NC 27616Email: StevenJVanDuser@Eaton.comPhone: (919) 523-8949www.eaton.com/powerxpert