Download
1 / 14
140 likes | 285 Views
Environmental Footprint Teachable Unit. By Elizabeth, Nancy, Mike, Nathan, Fallyn June 16-18, 2008. Brainstorming E ngage. How do Humans impact the environment?. media3.guzer.com/pictures/homers_brain.jpg. Brainstorming E ngage. What contributes to pollution?.

E N D
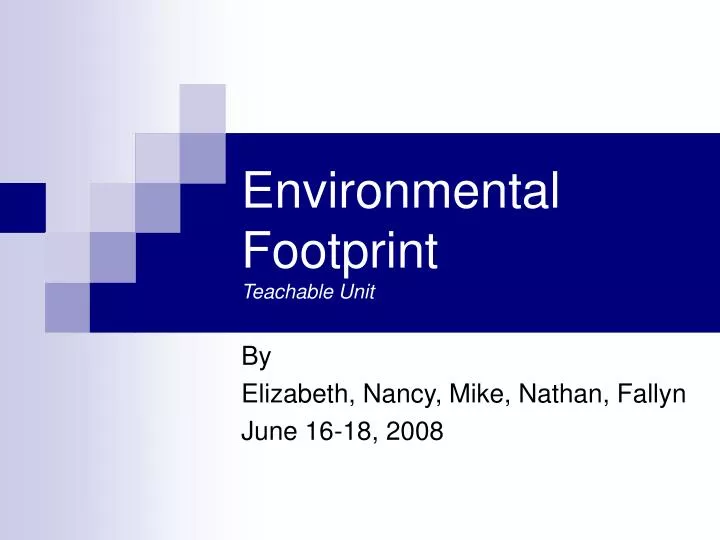
Environmental FootprintTeachable Unit By Elizabeth, Nancy, Mike, Nathan, Fallyn June 16-18, 2008
BrainstormingEngage How do Humans impact the environment? media3.guzer.com/pictures/homers_brain.jpg
BrainstormingEngage • What contributes to pollution? http://en.wikipedia.org/wiki/Image:Snpp.gif
Impact of Car Purchasing Choiceteachable tidbit • Learning Objective: • Analyzing the environmental impact of purchasing a car through graphing data http://girtby.net/images/homer-car.gif
Exploration Activity • Economic comparison of cars • How would you decide which car to buy? • Instructions • Create a line graph for your given data set comparing costs in thousands of dollars (Y-axis) versus time in years (X-axis)
Graphing Data (Example) Assume: Gas Price= $4. 50 per gallon Drive 12,000 miles per year
Graphing Data Assume: Gas Price= $4. 50 per gallon Drive 12,000 miles per year
ResultsExplain • Which car would you pick? Why? Car A (Green Line): C(t)=2355t+16,000 Car B (Red Line): C(t)= 1230t+23,000 Car C (Blue Line): C(t)=2700t+10,000 Car D (Yellow Line): C(t)=3855t+7,000 price Time
B: 2008 Civic Hybrid A: 2007 Scion tC C: 2002 Ford Mustang D: 1998 Jeep Grand Cherokee
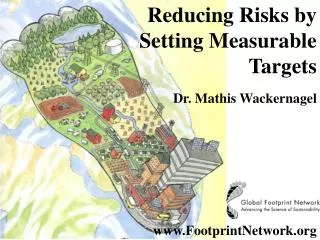
http://www.footprintnetwork.org/gfn_sub.php?content=global_footprinthttp://www.footprintnetwork.org/gfn_sub.php?content=global_footprint
http://www.footprintnetwork.org/gfn_sub.php?content=global_footprinthttp://www.footprintnetwork.org/gfn_sub.php?content=global_footprint
Evaluation • Would you change your mind, now accounting for the environmental impact?
Some Interesting Facts… • Driving your car for 3.75 miles (assuming 39 mpg) produces 1kg of CO2 • Flying in a plane for 1.375 miles produces 1kg of CO2 • Making 2 plastic bottles or 5 plastic bags produces 1kg of CO2 • Producing 1 American cheeseburger produces 3.1 kg of CO2 Timeforchange.org