Download
1 / 28
280 likes | 471 Views
Intelligent Data Engineering and Automated Learning - IDEAL 2004 5th International Conference, Exeter, UK. Wavelet Multi-scale Analysis of High Frequency FX Rates. Series: Lecture Notes in Computer Science , Vol. 3177. Saif Ahmad Department of Computing University of Surrey, Guildford, UK

E N D
Intelligent Data Engineering and Automated Learning - IDEAL 2004 5th International Conference, Exeter, UK Wavelet Multi-scale Analysis of High Frequency FX Rates Series: Lecture Notes in Computer Science , Vol. 3177 Saif Ahmad Department of Computing University of Surrey, Guildford, UK August 27, 2004
Talk Outline • Describing Time Series Data • Financial Time Series Data Characteristics • Wavelet Multiscale Analysis • Our Time Series Analysis Approach - Algorithms - Prototype System - Case Study - Conclusions • Questions
What Is a Time Series? • A chronologically arranged sequence of data on a particular variable • Obtained at regular time interval • Assumes that factors influencing past and present will continue
Trend TS Data Seasonal Cyclical Irregular Time Series Components
Trend Component • Indicates the very long-term behavior of the time series • Typically as a straight line or an exponential curve • This is useful in seeing the overall picture
Cyclical Component • A non-seasonal component which varies in a recognizable period • Peak • Contraction • Trough • Expansion • Due to interactions of economic factors • The cyclic variation is especially difficult to forecast beyond the immediate future more of a local phenomenon Time
Time Seasonal Component • Regular pattern of up and down fluctuations within a fixed time • Due to weather, customs etc. • Periods of fluctuations more regular, hence more profitable for forecasting
Irregular Component • Random, unsystematic, “residual” fluctuations • Due to random variation or unforeseen events • Short duration and non-repeating • A forecast, even in the best situation, can be no closer (on average) than the typical size of the irregular variation
Time Series Data Broken-Down* TS Data Trend Cyclic Behavior Seasonal Index Irregular *For illustration purposes only.
Evolve in a nonlinear fashion over time Exhibit quite complicated patterns, like trends, abrupt changes, and volatility clustering, which appear, disappear, and re-appear over time nonstationary There may be purely local changes in time domain, global changes in frequency domain, and there may be changes in the variance parameters Financial Time Series Data Characteristics
Financial Time Series Data Characteristics Nonstationary IBM Prices IBM Volatility Time Varying Volatility
Financial Time Series Data Characteristics Having said that… • The nonlinearities and nostationarities do contain certain regularities or patterns • Therefore, an analysis of nonlinear time series data would involve quantitatively capturing such regularities or patternseffectively How and Why?
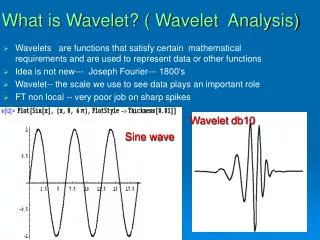
Wavelet Multiscale Analysis Overview • Wavelets are mathematical functions that cut up data into different frequency components and then study each component with a resolution matched to its scale • Wavelets are treated as a ‘lens’ that enables the researcher to explore relationships that were previously unobservable • Provides a unique decomposition (deconstruction) of a time series in ways that are potentially revealing
Signal Wavelet C = C1 Wavelet Multiscale Analysis Step I: Take a wavelet and compare it to a section at the start of the original signal. Calculate C to measure closeness (correlation) of wavelet with signal
Wavelet C = C2 Wavelet Multiscale Analysis Step II: Keep shifting the wavelet to the right and repeating Step I until whole signal is covered Signal
Wavelet Multiscale Analysis Step III: Scale (stretch) the wavelet and repeat Steps I & II Signal Wavelet C = C3 Step IV: Repeat Steps I to III for all scales
Wavelet Multiscale Analysis Filter Bank Approach Discrete Convolution:The original signal is convolved with a set of high or low pass filters corresponding to the prototype wavelet Xt Original Signal W High or low pass filters
Iteration gives scaling effect at each level Xt A1 A2 A1 A2 A3 D1 D2 D3 L H 2 2 2 Level 1 H Xt = A1 + D1 L Level 2 Frequency Xt = A2 + D1+ D2 L L Level 3 Xt = A3 + D1+ D2 + D3 Level N Xt = AN + D1+ D2 + … DN Mallat’s Pyramidal Filtering Approach Wavelet Multiscale Analysis Filter Bank Approach H: Bank of High Pass filters H* (f) H (f) 2 D1 Xt G: Bank of Low Pass filters G (f) G* (f) A1 H (f) – high-pass decomposition filter H* (f) – high-pass reconstruction filter G (f) – low-pass decomposition filter G* (f) – low-pass reconstruction filter Up arrow with 2 – upsampling by 2 Down arrow with 2 – downsampling by 2
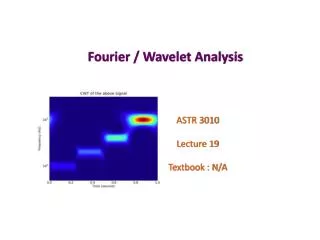
FFT (FTSE) FTSE 100 FFT (3) Level - 3 FFT (2) Level - 2 Level - 1 FFT (1) Wavelet Multiscale Analysis Wavelet Decompositions Fourier Power Spectrum
Knowledge Discovery Preprocessing Transformation Forecast Data Compression Multiscale Analysis Summarization Prediction Tick Data Aggregate the movement in the dataset over a certain period of time Use the DWT to deconstruct the series Describe market dynamics at different scales (time horizons) with chief features Use the extracted ‘chief features’ to predict Cycle Trend Turning Points Variance Change Analyzing High-frequency Financial Data: Our Approach
Analyzing High-frequency Financial Data: Our Approach Generalized Algorithm: Summarization
Analyzing High-frequency Financial Data: Our Approach Generalized Algorithm: Prediction
Raw Signal Volatility DWT Detect Turning Points and Trends DWT FFT Detect Inherent Cycles Prediction Summarization Statistic NCSS Detect Variance Change Analyzing High-frequency Financial Data: Our Approach A prototype system has been implemented that automatically extracts “chief features” from a time series and give a prediction based on the extracted features, namely trend and seasonality
Analyzing High-frequency Financial Data: Our Approach A Case Study Consider the five minutes compressed tick data for the £/$ exchange rate on March 18, 2004 Input Data System Output
Analyzing High-frequency Financial Data: Our Approach A Case Study For prediction, we use the ‘chief features’ of the previous day (March 18, 2004), information about the dominant cycle and trend (summarization), to reproduce the elements of the series for the following day (March 19, 2004): Actual March 19, 2004 Predicted (seasonal + trend) March 19, 2004 System Output Root Means Square Error = 0.0000381 Correlation = + 62.4 %
Analyzing High-frequency Financial Data: Our Approach Conclusions • We have presented a time series summarization, annotation, and prediction framework based on the multiscale wavelet analysis to deal with nonstationary, volatile and high frequency financial data • Multiscale analysis can effectively deconstruct the total series into its constituent time scales: specific forecasting techniques can be applied to each timescale series to gain efficiency in forecast • Resultsof experiments performed on Intraday exchange data show promise for summarizing and predicting highly volatile time series • Continuously evolving and randomly shocked economic systems demand for a more rigorous and extended analysis, which is being planned • Successful analysis of agentsoperating on several scales simultaneously and of modeling these components could result in more exact forecasts