Download
1 / 19
190 likes | 373 Views
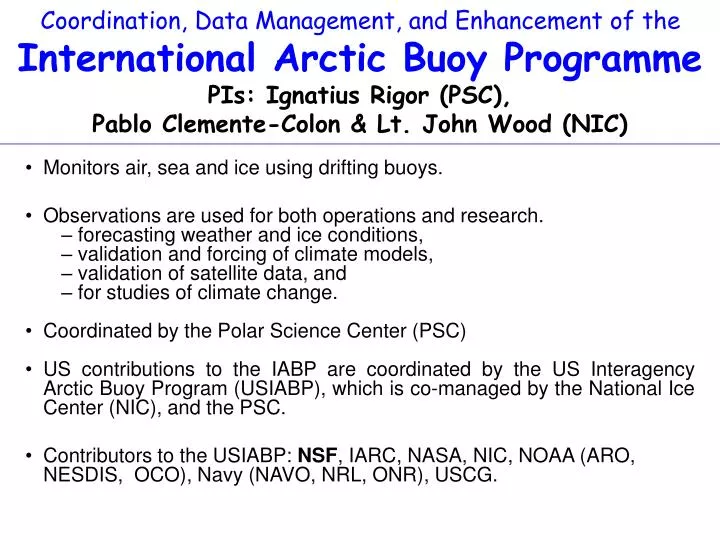
Coordination, Data Management, and Enhancement of the International Arctic Buoy Programme PIs: Ignatius Rigor (PSC), Pablo Clemente-Colon & Lt. John Wood (NIC). Monitors air, sea and ice using drifting buoys. Observations are used for both operations and research.

E N D
Coordination, Data Management, and Enhancement of theInternational Arctic Buoy ProgrammePIs: Ignatius Rigor (PSC),Pablo Clemente-Colon & Lt. John Wood (NIC) Monitors air, sea and ice using drifting buoys. Observations are used for both operations and research. forecasting weather and ice conditions, validation and forcing of climate models, validation of satellite data, and for studies of climate change. Coordinated by the Polar Science Center (PSC) US contributions to the IABP are coordinated by the US Interagency Arctic Buoy Program (USIABP), which is co-managed by the National Ice Center (NIC), and the PSC. Contributors to the USIABP: NSF, IARC, NASA, NIC, NOAA (ARO, NESDIS, OCO), Navy (NAVO, NRL, ONR), USCG.
IABP History • Arctic Ocean Buoy Program (AOBP) • Established by the Polar Science Center in 1978 to support the Global Weather Experiment. • International Arctic Buoy Programme (IABP) • Succeeded the AOBP in 1991 • Participants: 20 institutions, 2 international agencies, 8 countries: • Alfred Wegener Institute, Germany • Arctic and Antarctic Research Institute, Russia • Chinese Academy of Sciences, China • Christian Michelsen Research, Norway • Cold Regions Research and Engineering Lab, US • Collecte Localisation Satellites (Argos), France and US • Environment Canada, Canada • Institute of Ocean Sciences, Canada • International Arctic Research Center, U.S. • Japan Marine Science and Technology Center, Japan • Marine Environmental Data Service, Canada • Nansen Environmental and Remote Sensing Center, Norway • National Ice Center, U.S. • Naval Meteorological and Oceanography Command, U.S. • Norwegian Polar Institute, Norway • Norwegian Meteorological Institute, Norway • Pacific Marine Environmental Laboratory, U.S. • Polar Science Center, Applied Physics Lab, U.S. • Scott Polar Research Institute, U.K. • Woods Hole Oceanographic Institute, U.S. • World Climate Research Programme (WCRP), and • European Meteorological Network (EUMETNET)
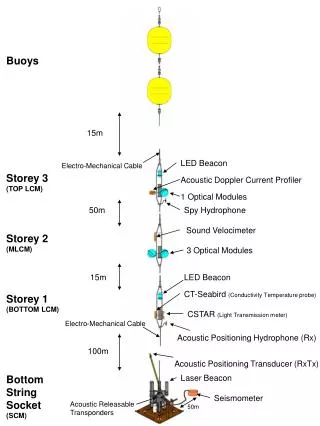
Ice Mass Balance buoy Monitors Air and Sea Ice (blue dots) Most of POPS is below the surface Polar Ocean Profiling System Monitors Air and Ocean (typically deployed with IMB buoys) ICEX airdrop buoys are the backbone of the IABP (red dots) IABP Latest Positions
IMB and Ocean Observations Maintaining the array is a challenge! IABP Automated Drifting Stations Changes in ice thickness can be attributed to top or bottom forcing! • Enhanced buoys, e.g. IMB, POPS, ITP, GPS buoys) are collocated to form Automated Drifting Stations (ADS) • Currently there are 8 ADS’ deployed.
Age:OW 0 1 2 3 4 5 6 8 10+ Years Drift based estimates of the Age of Ice 1980’s (low AO, large gyre) Present (high AO, small gyre) Russia Sep 1987 Sep 2006 Alaska Arctic Ocean Canada • Easier to maintain buoy array under low AO conditions • Larger Beaufort Gyre sweeps buoys from Canadian Basin into Eurasian Basin • Older, thicker sea ice is less hazardous for buoys.
IABP Deployment Plans for 2007 & IPY • 130 buoys will be deployed in 2007 for the IPY! (Average is 25 buoys/year.) • 12 deployments will be clustered in ADS’. • Ice Camp (30 buoys) • NPEO (3 ADS’, 12 buoys) • DAMOCLES (8 Ocean Buoys, 2 IMB, 3 Met. Buoys) • Beaufort Gyre (WHOI, 2 ITP, and 2 IMB buoys) • The hole in the Eurasian Basin will be filled primarily by European Collaborators. • USIABP Deployments: • 3 met. Buoys at ice camp (Deployment # 1) • 1 IMB and 2 met. Deployed by Environment Canada (# 4) • 5 met. by NPEO (# 6) • 3 met. by DAMOCLES (#7) • 1 IMB by Polarstern (#9) • 2 met. by NAVO (#10) • 4 met. by Healy (# 11) • Total: 19 met. & 2 IMB buoys • NAVO will also deploy 8 other buoys which were provided by non-US collaborators (# 10). • For more details, see http://iabp.apl.washington.edu/Deploy2007/.
IABP Summary • Longest, continuing observational record over Arctic Ocean, 1979 – present. • Over 500 papers have been written using observations from the IABP! (http://iabp.apl.washington.edu/Citations/) • SLP and SAT observations provide a cornerstone for the Arctic Observing Network, i.e. are used by many operational and research projects. • Collaboration and coordination among international partners are two of the keys to the IABP’s success, e.g. some collaborators provide deployment logistics, while others provide buoys. • The IABP is evolving by deploying enhanced buoys (e.g. IMB, ITP, POPS, etc.), and producing new data products (e.g. age of sea ice). • Data Management: • Data are provided to operational users in near real time through the GTS. • Research data are analyzed at PSC and available from the IABP web server: IABP.apl.washington.edu. • Data are archived at MEDS, NSIDC.org, etc. • Challenges: • Maintaining the array is difficult, especially in the Eurasian Arctic where the changes in wind quickly blow ice away from the coast and into the Transpolar Drift Stream. In the 1980’s the large Beaufort Gyre helped maintain a well spaced array. • Most of the observations are on multi-year sea ice. The US-IABP is developing an air droppable seasonal ice buoy, but many of the seasonal ice areas are hard to reach. • Synergies: Buoys are cheap compared to logistics. All flights and ships operating in the Arctic are deployment opportunities.
USIABP Contributing Agencies IARC NASA NSF NAVO Funds Funds Funds NOAA NESDIS Funds FTE Deployment Logistics USIABP National Ice Center & Polar Science Center NOAA ARO ONR Funds Funds NRL NOAA OGP Engineering Support Funds Argos Deployment Logistics USCG
NOAA SBIR - Inexpensive Airborne Expendable Ice Buoys (AXIB) • Provides a low cost aircraft droppable seasonal buoy (with also surface deployment capability) • Sensors/measurements include surface air temperature, surface pressure, GPS location, and Argos transmitter • Operation in ice and open water through freeze/thaw cycles • LBI, Inc. submitting proposal for phase II SBIR funding Provide alternatives to White Trident C-130 drops over MYI
CANADA Arctic Ocean RUSSIA Alaska IABP Data &Weather Forecasting The observations (red dots) from the IABP are essential for analyzing and forecasting weather features in the Arctic. In this example, we show storm approaching Alaska from the Arctic Ocean. The IABP observations are essential in detecting and determining the strength and trajectory of storms from the Arctic Ocean. (Figure provided by Eric Stevens, NWS/NOAA, Fairbanks, AK)
IABP Obs. & Climate StudiesChanges in Atmospheric Circulationfrom 1979 – 1994 Using the IABP Sea Level Pressure (SLP) fields, Walsh et al. (1996) showed that SLP dropped by as much as 4 mb over the Arctic Ocean, which drives a counter-clockwise anomaly in ice motion (right). These figures show the mean field of SLP and ice motion for 1979 – 1986 (left), 1987-1994 (middle), and the the difference between these two 8 year periods (right). This is one of the first studies to observe Arctic Climate Change!
Asia Europe PAC I F I C Arctic Ocean ATLANTIC North America Surface Air Temperature (SAT) Climatology from IABP/POLES SAT analysis • 12-hourly fields have been analyzed from 1979 to present. • The IABP/POLES SAT fields show that coldest region in the Arctic is over Siberia during winter. Over the Arctic Ocean, the coldest area is north of the Canadian Archipelago, and during summer the air temperature is close to the freezing point of sea ice.
Asia Europe PAC I F I C Arctic Ocean ATLANTIC North America Surface Air Temperature (SAT) Trendsfrom IABP/POLES SAT analysis Winter (DJF) Spring (MAM) Summer (JJA) Fall (SON) • Temperatures have warmed during all seasons, especially during winter and spring • Some cooling is noted during winter and fall in the Canadian Arctic. (IABP SAT data from 1979 – 1998. Adapted from Rigor et al. 2000)
Surface Air Temperature (SAT) Reanalysis:Buoy Obs. Vs. ERA-40 Comparison between the SAT observations from buoy 1301, which drifted between Ellesmere Island and Greenland, and the SAT estimates from ERA-40 at the coinciding locations. The SAT observations from the buoy appear to be consistently warm-biased indicating a possible calibration issue for this particular buoy, or ERA-40 may not be able to resolve subgrid-scale variations in SAT in the Canadian Archipelago.
Control TESSEL Observations (IABP) 1 Oct 1998 21 Sep 1999 Sea-ice two-metre temperature Model Validation Validation of 2-m temperature estimates from ECMWF Reanalysis. Courtesy of Pedro Viterbo.
IABP Data &Model Validation: PIPS 2.0 Validation of Polar Ice Prediction System (PIPS) 2.0 Ice Motion (top right) against IABP SLP and buoy motion (top left). The lower figures show the analyzed ice concentration (bottom left) and thickness (bottom right). Courtesy of Ruth Preller & Pam Posey, NRL.
Satellite Validation – Radarsat-GPS Validation of Radarsat-GPS ice motion products. These figures show how IABP observations have been used to validate satellite ice displacement measurements. On the left is a map showing the location of the comparison and on the left is the motion of the buoy and the nearest RGPS trajectory. The buoy positions (dots) are for every 3 hours. The RGPS positions (crosses) are from roughly every 3 days. The comparisons show that the RGPS is at least as accurate as the buoys (Lindsay and Stern, 2002). Courtesy of Ron Lindsay.
Variance Explained Percent of Variance of SIEExplained by the Age of Sea Ice Age of Ice in September 2006 Sep 2006 (Rigor et al., 2004, Updated)