Download

1 / 5
50 likes | 254 Views
Quantifying memory access locality in high-performance computing apps using a multi-level memory model with normalized access metrics. Detailed study on dynamic execution hierarchy and capacity boundaries.

E N D
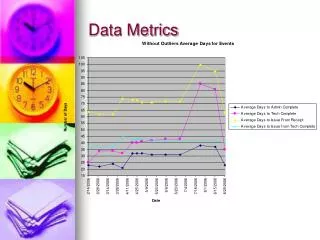
Global Data Motion Difficulty Metrics Allan Snavely PMaC Lab, UCSD
Working Set Graphs “Quantifying Locality in the Memory Access Patterns of HPC Applications”, Weinberg and Snavely, SC2005
KB Level 0, time = 1 energy = 1 MB Level 1, time =F(1) energy = G(1) Chip boundary Level 2, time =F(2) energy = G(2) GB Processor boundary Level 3, time =F(3) energy = G(3) TB Abstract memory hierarchy
Cont. • Levels in [0,1,2,3…] • Every level has a capacity in Kbytes • The capacity grows as baselevel; in the picture the base is 1000 • The levels and capacities cross some architectural boundaries dictated by available technologies (on chip, on processor, on machine etc.) • The time and energy to access an element of Level 0 is normalized to 1 • The time to access a level other than 1 is a function F of level (F could be piecewise) • The energy to access a level is a function G of level (G could be piecewise)
Cont. • Note Bill Dally proposed something like G (a piecewise function): If capacity(level) < chip boundary G = 1 + SQRT(capacity) Else If capacity(level) < processor boundary G = 1 + LARGE + SQRT(capacity(level)) Else G = LOGbigbase(capacity(level)) • Now consider taking every data access in a program during dynamic execution, determining what level of a concrete memory hierarchy on which it is executed it falls in, what is the capacity of that concrete level, what is the smallest capacity of the abstract level that can hold the concrete level, and recording this. (This was the exact procedure used to generate figure 1). • Associated with each access we then have a level and a time and an energy, associated with accesses to that level (F and G of level) according to the abstract/simple model.