Download
1 / 26
270 likes | 442 Views
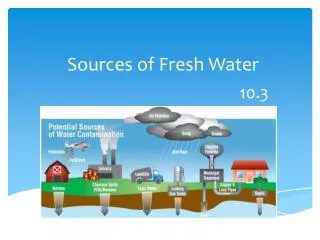
Improving Water Quality: Controlling Point and Nonpoint Sources. Chapter 15. 1.Point Source Controls Technology-Based Effluent Limits. End-of-pipe limits that differ by various groups, such as direct dischargers and indirect dischargers Within any group, the limits are applied ______________

E N D
Improving Water Quality:Controlling Point and Nonpoint Sources Chapter 15
1.Point Source ControlsTechnology-Based Effluent Limits • End-of-pipe limits that differ by various groups, such as direct dischargers and indirect dischargers • Within any group, the limits are applied ______________ • For direct industrial dischargers, the standards are industry-specific and vary by facility age (new versus existing) and type of contaminant released
Direct dischargers release pollution directly to surface waters. Indirect dischargers release effluents to publicly owned treatment works which treat wastewaters through sewer systems.
Limits are based on technological capability, but polluters can choose the method to achieve them • Therefore, the limits are ______________________ ____________ • Policy intent is to lower limits over time until the ________ discharge goal is met • Limits are conveyed through a permit system called the National Pollutant Discharge Elimination System (NPDES) • NPDES prohibits any discharges into navigable waters without a permit • Each permit states what the effluent limits are and the monitoring and reporting requirements
Individual homes that are connected to a municipal system, use a septic system, or do not have a surface discharge do not need an NPDES permit; however, industrial, municipal, and other facilities must obtain permits if their discharges go directly to surface waters. FYI
2. Analysis of the Effluent Limits:Major Problems Imprecise Statutory Definitions • Limits are based on what is technologically achievable instead of what is needed to achieve water quality • As a result, _______________________(TMDLs)had to be established for all polluting sources if water quality goals were not being met, even if the technology-based limits were being satisfied • TMDLs are the maximum amount of pollution a water body can receive without violating the standards Arizona currently has 102 waterbodies on the 303(d) list (impaired water identification).
FYI Cost-Ineffectiveness • Cost-effectiveness requires that firms abate to the point where their associated MACs are equal • Since the limits are applied uniformly, this criterion would not be achieved unless firms were identical • Empirical evidence suggests that the command-and-control (CAC) approach used is more costly than using economic incentives • Various studies estimate the ratio CAC policy cost to that of a least-cost, market-based approach • O’Neil (1980): 2.29 to1 • Faeth (2000): 5.9 to 1 • Johnson (1967): 3.13 to 1
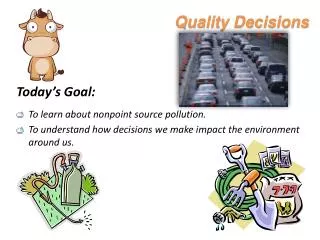
3. Nonpoint Source ControlsNonpoint Source Management Program:Water Quality Act of 1987 • 3-stage, _________________________ plan • Report on waters not achieving standards • Develop ___________________________(BMP) to reduce pollution • BMP: strategies other than effluent limits • Implement the programs • Federal grants are available to support plans
Examples of BMP in agriculture include practices for the management of pests; vegetative and tillage practices, such as contour farming, cropping sequence… Contour farming is the farming practice of plowing across a slope following its elevation contour lines. The rows formed slow water run-off during rainstorms to prevent soil erosion and allow the water time to settle into the soil.
4. Analysis of Nonpoint Source Controls • Advantages of state control • better knowledge of local water bodies, precipitation, runoff, etc. • nonpoint pollution is linked to land use practices, which is controlled locally • Disadvantages of state control • lack of good data • inadequate monitoring systems • controls are not consistent across states; can cause problems if contamination flows across state borders Such as agriculture, mining, forestry, and urban development.
At the federal level: Insufficient resource allocation to nonpoint controls relative to point source controls US Spending: Point vs. Nonpoint ($2008 millions) Source: U.S. EPA, Office of Policy, Planning, and Evaluation (December 1990), p. 3-3, Table 3-3.
5. Market-Based Solutions(1) Pollution Chargesa. Effluent Fees on Point Sources • These can be ______________ or ______________ • Some states in the U.S. are using these fees as well as other nations—France, Germany, China…… • Usage can lead to cost-effectiveness • If government sets a per-unit marginal effluent fee (MEF), each polluter would abate as long as their marginal abatement cost (MAC) is less than MEF and continue until MAC = MEF • So all polluters abate to the point where their MACs are equal, which indicates a cost-effective result
MEF unit fee AX AY Modeling an Effluent Fee $ $ MACX MACY A A Polluter X Polluter Y Notice that both firms are abating at levels where their respective MACs are equal to the MEF, which means they are equal to each other—a cost-effective result.
b. Product Charges on Nonpoint Source Example: Tax on fertilizers • Tax effective Pfertilizer quantity demanded • Optimal tax equals MEC at QE • Evidence in the U.S. suggests D for fertilizer is relatively ____________ and tax rate is too low • Result: insufficient demand response • 46 states use this; rates tend to be < 2.5%, so the decline in quantity demanded is negligible • Some European nations, such as Austria and Sweden, have used fertilizer taxes with measurable effects
(2) Tradeable Effluent Permit Markets • Set an abatement objective for watershed • Issue tradeable effluent permits • Low-cost abaters sell as long as P > their MAC • High-cost abaters buy as long as P < their MAC • Trading continues until MACs equal, which yields acost-effective abatement allocation • Tradeable permit markets involving both point and nonpoint sources exist in some states • e.g., CA, CO, FL, NY, and WI
6. Watershed Approach • A watershed refers to all land areas draining into a particular water body • Focuses on the watershed instead of a specific water body allows for • better assessment of water quality • better identification of polluting sources • Underlying motivations are: • to integrate policy initiatives, using pollution prevention where possible • coordinate tasks and resource use among all stakeholders associated with the watershed
Primary U.S. Policy Instruments • Watershed-based NPDES permits:issued to multiple point sources within a watershed • Water quality trading • U.S. policy explicitly states that all trading activity should occur within a watershed • Supported by economic arguments, including cost savings, scale economies, and greater efficiency
FYI Ch3-slide 18 Modeling a Negative Environmental Externality (negative production externality) • Define the market as refined petroleum • Assume the market is competitive • Supply is the marginal private cost (MPC) • Demand is the marginal private benefit (MPB) • Production generates pollution, modeled as a marginal external cost (MEC) • Problem: Producers (refineries) have no incentive to consider the externality • Result: Competitive solution is inefficient water pollution
FYI Ch3-slide 23 MSC, MPC, MPB Graph P ($ per barrel) Page 67 42 MSC = MPC + MEC S =MPC PE = 26 PC = 22 10 D = MPB = MSB 0 128 160 Q (thousands) QE QC
FYI Ch5-slide 6 Modeling a Pigouvian Tax (on a negative production externality) tax=MEC at QE $ MSC = MPC + MEC MPCt MPC a Amount of tax b MPB = MSB 0 Q of gasoline QE QC
FYI Modeling a positive production externality subsidy = -MEC at QE $ MPC MPCs a MSC = MPC + MEC b MPB = MSB 0 Q of gasoline QC QE
FYI Ch5-slide 15 Abatement Equipment Subsidy (on a Positive Consumption Externality) • A payment aimed at lowering the cost of abatement technology • Goal is to internalize the positive externality associated with the consumption of abatement activities • If the subsidy equals the marginal external benefit (MEB) at QE,it achieves an efficient equilibrium and is called a Pigouvian subsidy
FYI Ch5-slide 16 ($ millions) MSC K Subsidy = $14 million PE = 175 PC = 170 MSB=MPB+MEB L PE – s = 161 MPBS MPB 0 QC = 200 QE = 210 Q of scrubbers Pigouvian SubsidyMarket for Scrubbers (on a Positive Consumption Externality) Subsidy=MEB at QE
FYI P 50 $ external benefit 40 30 20 10 Q 0 0 10 20 30 25 Analysis of a Positive Consumption Externality The market for flu shots Socially optimal Q= ___ shots To internalize the externality, use _______ = $10/shot. 25 subsidy S Social value = private value + external benefit D External benefit = $10/shot 25
Analysis of a Negative Consumption Externality Modeling a Tax on Consumption FYI tax= -MEB at QE $ MSC a Amount of tax b MPB MPBt MSB = MPB + MEB 0 Q QE QC