Download
1 / 16
170 likes | 459 Views
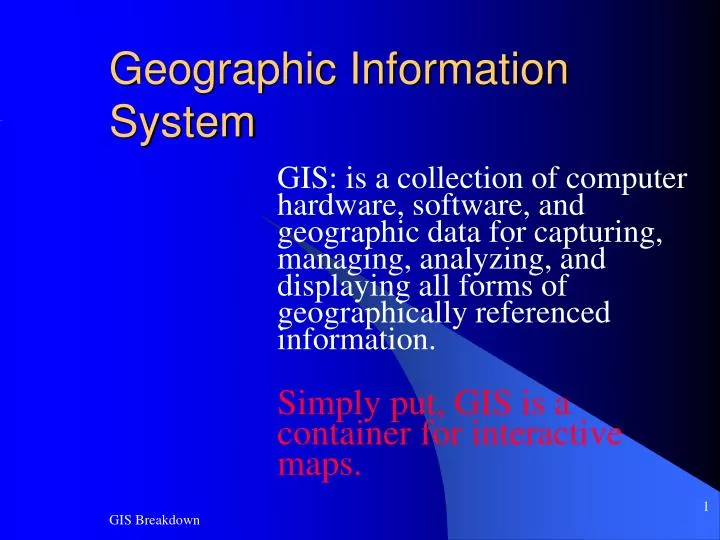
Geographic Information System. GIS: is a collection of computer hardware, software, and geographic data for capturing, managing, analyzing, and displaying all forms of geographically referenced information. Simply put, GIS is a container for interactive maps. Important GIS Terminology.

E N D
Geographic Information System GIS: is a collection of computer hardware, software, and geographic data for capturing, managing, analyzing, and displaying all forms of geographically referenced information. Simply put, GIS is a container for interactive maps. GIS Breakdown
Important GIS Terminology • GIS: Geographic Information System • Spatial: Of, relating to, involving, or having the nature of space. • Database: a comprehensive collection of related data organized for convenient access, generally in a computer. • Analysis: The separation of an intellectual or material whole into its constituent parts for individual study. • ATTRIBUTE: something attributed as belonging to a person, thing, group, etc.; a quality, character, characteristic, or property: Sensitivity is one of his attributes. information provided: http://dictionary.reference.com/ GIS Breakdown
Field Collection and Digitization: Step one • GPS: A system of satellites, computers, and receivers that is able to determine the latitude and longitude of a receiver on Earth by calculating the time difference for signals from different satellites to reach the receiver. • When we GPS we are collecting points, polygons, and lines with our GPS equipment and assigning them a latitude and longitude coordinate and attributing them accordingly for analysis, querying (a statement of expression used to select features from a database), navigation, and map design. • Digitization: To put (data, for example) into digital form. We use the aerial photography (if we do not GPS) to draw (digitize) boundaries, building footprints, fire hydrants, water meters, etc… (Hence Digitization) information provided: http://dictionary.reference.com/ Photo provided by: http://www.trimble.com/ranger.shtml GIS Breakdown
After GPS or Digitization • After each item or items are GPSed (hydrants, water lines, brine wells, street signs) they are brought back into the office and uploaded onto our computers (taken off the GPS equipment and placed onto our computer or if digitized no uploading is required because it is already on our computer.) • Once uploaded we use ArcInfo (our mapping software), Microsoft Access, Trimble Pathfinder, or Microsoft Excel for additional attributes, further modifications if needed, analysis, querying, and MAP DESIGN. GIS Breakdown
Layers • Each item or items that are GPSed or digitized are called layers and are attributed for analysis, manipulation, and so on (as stated in the previous slide.) • Anything you can think of, water meters, council districts, city zones, sewer lines, street center lines, well houses, hike-bike trail, building footprints, is a layer (dataset.) Photo provided by: http://gisgeek.pdx.edu/G425-FieldGIS/layers.gif GIS Breakdown
Layers, Layers, Layers • When working with these layers we have the option of working with one or many. • For example, we can either work with the parcels, street center lines, city limits, and water lines all together or one at a time (depending on what the department or individual is asking for.) • Basically, a layer is either a point(s) hydrant(s), a line(s) hike-bike trail, or a polygon(s) building footprints and each is attributed accordingly and combined with other layers to design a layout or a map. • We have over 150 layers we maintain, update, and several others that are in the process of being built. GIS Breakdown
What you see vs. What we do • We are not mapping makers, that is only our end product. • What most of you do not see is that 90% of our layers (datasets) require maintenance and are a constant work in progress. • Zones change, water lines are added, hydrants are added, water meters are removed, subdivisions are built, crimes are committed everyday (that need a reference point and attributes), streets are paved, sewer lines are added, and so on. • Here are a few visual examples of what you see vs. what we do. GIS Breakdown
What you see vs. What we do Photos provided by: City of Hutchinson and http://www.freedownloadscenter.com/Best/dbase-photos.html GIS Breakdown
What you see vs. What we do Photos Provided by:www.esri.com GIS Breakdown
What you see vs. What we do Photos Provided by: City of Hutchinson and www.esri.com GIS Breakdown
Static vs. Dynamic • Static: pertaining to or characterized by a fixed or stationary condition. • Dynamic: characterized by continuous change, activity, or progress: a dynamic market.http://dictionary.reference.com/ • Depending on a departments budget, their accessibility to computers, laptops, or PDA’s most departments use static maps. • Static maps are very good for static purposes. Such as, a quick print out of an area, an area or boundary that does not change much, and etc., but if you need information about the depth of a manhole, when the last time a hydrant was serviced, when a particular valve was exercised, and so on then static can only do so much. • Of course you can look up all this information, but if you have all of the information in a dynamic map then it’s only a click away. GIS Breakdown
Dynamics • When points, lines, and polygons are GPSed or digitized and attributed then GIS makes it possible for them to be dynamic. • With the click of a mouse you are able to see the length, diameter, upstream and downstream flow of a sanitary sewer system, you are able to zoom into an area and see where you property lines are located, what your house is appraised at, what voting precinct, council district, and school district you are in, and so much more. • Without GIS, dynamics would not be possible. GIS Breakdown
Summary • We collect the data (GPS or digitization.) • We upload the data from our GPS. equipment onto our Computers. • We analysis, maintain, manipulate, edit, and built data with our mapping software. • Data is constantly being updated and improved. • Finally, we deliver a static or a dynamic map to you. GIS Breakdown
Conclusion: • Everything is spatial: Whether it be yourself sitting at a desk, a hydrant, property lines, subdivisions, water lines, sewer lines, crime scene, parking lot, or whatever, it’s all spatial and GIS works by linking information-data-to a geographic location (Longley, Maguire, and Rhind pg. 2.) • The power of GIS lies in the fact that using computer technology and conceivable kinds of information can be linked to any geographic location (Longley, Maguire, and Rhind pg. 2.) • Look at it this way, in a GIS, maps become super maps. When you look at a road on a static or a traditional paper map, you learn roughly where it goes, its names, and that’s about it. Click on that same map in a GIS and you can find out how many lanes the road has, when it was built and by which construction company, the composition of the road surface, and when the potholes in it are scheduled to get filled (Longley, Maguire, and Rhind pg. 2.) GIS Breakdown
Check Us Out • www.rhmap.com • www.hutchgov.com GIS is in the Information technology section • http://www.rhmap.com/website/Recycling/viewer.htmArcCatalog • http://www.rhmap.com/website/eastside_cemetery/viewer.htm • http://www.rhmap.com/website/hfdiso/viewer.htmHyperlinks GIS Breakdown
Additional Information GIS Department • IT Director: Todd Davis (620-694-2602)toddd@hutchgov.com, • GIS Supervisor: Andy Henry (620-664-8106)andyh@hutchgov.com, • GIS Technician II: Tracy Roberts (620-664-0260)tracyr@hutchgov.com, • GIS Technician I: Allen Shafer (620-664-0238)allens@hutchgov.com • Also check our website at www.hutchgov.com GIS Breakdown

![Geographic Information System [GIS]](https://cdn2.slideserve.com/5315378/geographic-information-system-gis-dt.jpg)