Download
1 / 18
180 likes | 281 Views
Confidence rating of eutrophication assessment in the open Baltic Sea- a case study. CONFIRM-workshop, Copenhagen 6.3.2009 Hermanni Kaartokallio (Vivi Fleming-Lehtinen, Anna Villnäs, Alf Norkko). Background.

E N D
Confidence rating of eutrophication assessment in the open Baltic Sea- a case study CONFIRM-workshop, Copenhagen 6.3.2009 Hermanni Kaartokallio (Vivi Fleming-Lehtinen, Anna Villnäs, Alf Norkko)
Background • Eutrophication assessment confidence rating presented here is mainly related to the first HELCOM thematic eutophication assessment of the Baltic Sea. • The work has been carried out in the Finnish Institute of Marine Research (SYKE Marine Centre as of 1.1.2009).
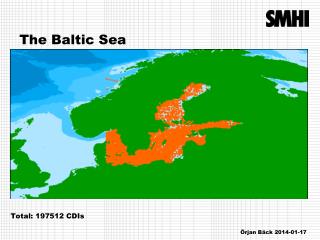
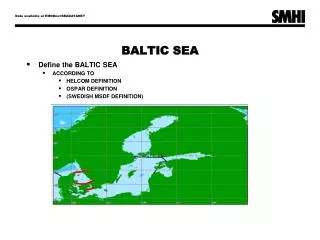
Outline of the study • 7 Baltic sea open sub-basins: Bothnian Bay, Bothnian Sea, Gulf of Finland, Northern Baltic Proper, Eastern Gotland Basin, Bornholm Sea, Arkona Sea. • Multiple indicators for cat. I, II and III eutrophication effects.
Outline of the study • Status/confidence rating for three quality elements in northern sub-basins, two quality elements for central/southern sub-basins • Confidence rating for reference conditions, boundary setting (acceptable deviation) and actual status
Indicators included • QE Plankton/Causative factors • Summer (Jun-Sep) surface chlorophyll-a • QE Invertebrate benthic fauna/Indirect effects • Average number of taxa • QE Physico-chemical features/Other possible effects • Summer (Jun-Sep) secchi depth • Winter (Dec-Feb) surface dissolved nutrients (NO2+NO3, PO4)
Principles in confidence rating • Reference conditions and actual status: • Spatial and temporal representativeness of data • Time difference between oldest data and reference period/method used in reference setting • Boundary setting • Availability of information on functional relations between pressures and indicator responses • Specificity for eutrophication effects
Chlorophyll-a: indicator outline • HELCOM COMBINE (at ICES) and FIMR summer (Jun-Sep) surface data • Four sub-basins (BoB, BoS, GoF, NBP) • RefCon: historical data/trend extrapolation back to 1940s, comparison to model results • AcDev: Normative maximum (50%) applied • AcStat: mean of summer observations 2001-2006
Chlorophyll-a: Confidence rating • RefCon: Class II • Time gap between reference • period and oldest data • AcDev: Class II • Normative maximum AcDev used • AcStat: Class I • Representative data for open basins, • spatially corresponds the oldest data • No weighting • (only indicator in QE) Red= RefCon, Green=AcStat
Average no. of BIF taxa: Indicator outline • Gamma diversity of BIF (basin scale) • All seven sub-basins (BoB, BoS, GoF, NBP, EGB, BS, AS) • FIMR data (>100 stations, 1964-2006)+ additional swedish data for BS and AS
Average no. of BIF taxa: Indicator outline • RefCon: 10 % maximum from 1964-2006 data, (stations >40 m deep, an/hypoxia excluded) • AcDev: Relative standard deviation/year (limited to < 40%), reflect natural fluctuations. • AcStat: mean of 2001-2006 data/sub-basin
Average no. of BIF taxa: Confidence rating • RefCon: Class I/II • Data reliability (single source, • uniform methods, sufficient coverage) • AcDev: Class II • Direct eutrophication effect not fully • distinguishable, lack of data in south • AcStat: Class I/II • Spatial representativeness of • data (class II in EGB, BS and AS) • Weighting • 67/33% in EGB with areal contribution of S and C parts Red= RefCon, Green=AcStat
Secchi depth: Indicator outline • HELCOM COMBINE (at ICES) and FIMR summer (Jun-Sep) data + additional data • All seven sub-basins • RefCon: median of historical data from 1903-1907 • AcDev: Normative maximum (-25%) applied, for some basins also functional relations known • AcStat: mean of summer observations 2001-2006
Secchi depth: Confidence rating • RefCon: Class I • Sufficient historical data available • AcDev: Class I/II • Class I for N basins with an analysis • of secchi/chl-a functional relations • AcStat: Class I • Seasonally and spatially representative • data for open basins • Weighting • Equal weighting based on number of indicators in QE, except in BoB, where weighting of 40% (of three indicators) Red= RefCon, Green=AcStat
HEAT vs. OSPAR COMP • Identical results both for status and confidence rating, except status classification in Bothnian Bay, due to QE ”physico-chemical features/other effects” • Confidence rating Class II for all areas except Arkona Sea (Class III)
Conclusions • The study presents an example how different indicator features can be utilized in confidence rating. • Relatively simple, robust indicator features can be used in confidence rating. • Confidence rating with HEAT tool as a feasible and effective way to evaluate and display eutrophication assessment quality.