Download
1 / 37
370 likes | 511 Views
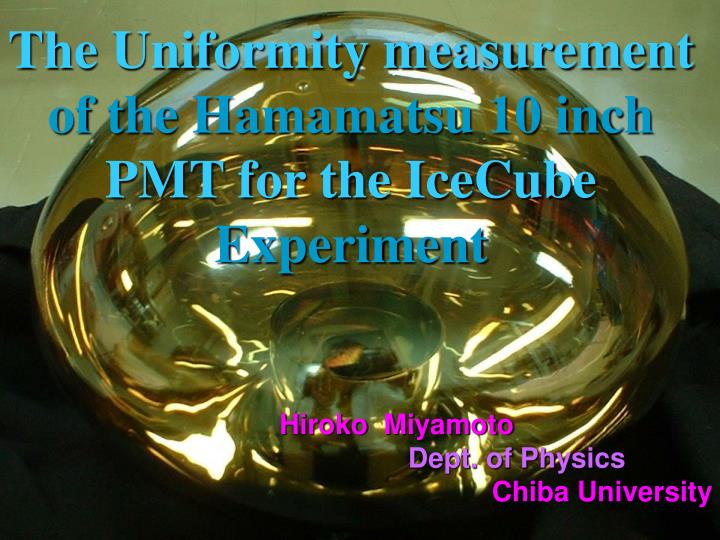
Basic Measurement of the Hamamatsu 10 inch PMT at –40 degree Hiroko Miyamoto Dept. of Physics CHIBA University. The Uniformity measurement of the Hamamatsu 10 inch PMT for the IceCube Experiment.

E N D
Basic Measurement of the Hamamatsu 10 inch PMT at –40 degree Hiroko Miyamoto Dept. of Physics CHIBA University The Uniformity measurement of the Hamamatsu 10 inch PMTfor the IceCube Experiment Hiroko Miyamoto Dept. of PhysicsChiba University
Our Work Chiba university group is working for both software and hardware part. • Software–develop the Java-based propagator of high energy cosmic neutrino in the earth and the ice. • Hardware–uniformity measurement of the PMT, gain measurement @-32℃, absolute QE, etc.
Signal〓QE×CE×Gain Gain Collection Efficiency (CE) Quantum Efficiency (QE) photoelectron photon
UV LED (LIGHT SOURCE)
PCI GPIB CAMAC Interface Function Generator CAMAC GPIB Interface Crate Controller 8ch ADC 50 nsec Sync. 200 nsec NIM 10 inch PMT Gate Generator UV LED Preamp TTL-NIM High Voltage Freezer 1750 V
The Result of the Gain Measurement @ -32℃ See more results : http://www-ppl.s.chiba-u.jp/research/IceCube/pmt/ screening/FY2003/index.html
2D SCAN SYSTEM PMT UV LED R-guide Rotation-bed Motor
108Gain 75nsec
The Measurement(of the first 14PMTs) The Light Source – UV (380 nm) Nichiya LED (220W driving) Collimated to less than 1mm diameter on the surface of PMT. Flashing at the every 1.3mm point on the R-guide. The Pulse is formed by the Agilent Func. Generator (100 nsec) 30photoelectrons/shots, corresponding the average of 3000 shots. [204 points/slice] PMT – Hamamatsu R7081 “ –02 tube. HV – 2000 V, 5E7~5E8 Gain Dark current ~ 404 mA @ 2000V (~363 mA @ 1800V) Noise Rate ~100 Hz ~2.5kHz with 50 mV threshold @ room temperature.
Table 2 : Possible Error The total length on cathode : 26.6 cm
Projection of length from on the X axis to the surface of PMT ( h → l ) PMT r θ R-guide rsinθ = h Step Number C ∝ h l l ∝ sin-1θ h X l = r sin-1(k/r・C)[cm]
Results • Calibration for data analysis • Effect of the geomagnetic field • Gain dependence • PMT by PMT difference
Calibration 1: The fluctuation of LED 0 [deg] vs 360[deg] 0[deg] vs 180[deg]
Calibration 2 : Reduction of the shape of crack of Magnetic Shield.
Result 1: The effect of the geomagnetic field With B shield Without B shield
Compare the average of the effect of B shield. Blue : with B shield Magenta : without B shield
Summary 1 : the effect of geomagnetic field and B shield • The effect of the geomagnetic field can be seen at ~10% level. • B shield reduces the effect of geomagnetic field, ~5% still remains.
Result 2: Gain dependence 2000V vs 1800V sf0050 azimuth 67.5[deg] sf0050 azimuth 123.75[deg]
Summary 2: Gain dependence • The gain difference of the efficiency is at 5% level, which is not significant except around the edge.
Result 3: PMT by PMT difference SF0030 vs SF0050 SF0016 vs SF0050
Summary 3 : PMT by PMT difference • The difference of the collection efficiency from a PMT to PMT shows the variance by 10% at maximum in the average, but, point to point difference reach 20% level. • A single PMT cannot represent all PMTs.
Discussion: 2 dimensional view of the cathode surface
Executive Summary • Completed the 2D survey data for IceCube detector MC implementation. • Geomagnetic filed effects at ~5% level. • Gain vs Collection efficiency is not significant, less than ~5% . • PMT by PMT difference is remarkable which reach ~20% level.
Outlook • Absolute Quantum Efficiency : PMT/DOM • Gain Scanning • Wave Form data taking • Angular Response • DOM simulation
Monitor PMTs Laser Baffles Calibrated PMT Future plan • Now, we start developing new scattering box. • Easy to change PMTs Useful to calibrate many PMTs • To exchange gas, we will use vacuum pump We can easily control the gas quality.
Signal〓QE×CE×Gain Gain Collection Efficiency (CE) Quantum Efficiency (QE) photoelectron photon