Download
1 / 10
100 likes | 221 Views
Aggregate Demand. Definition. Aggregate Demand is the total spending on goods and services in an economy over a given period of time. It is calculated using the following formula: C+I+G+(X-M). The Aggregate Demand Curve. General Price Level.

E N D
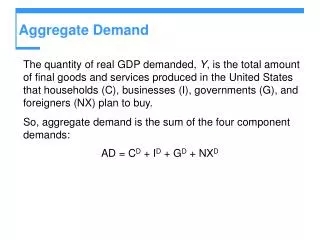
Definition Aggregate Demand is the total spending on goods and services in an economy over a given period of time. It is calculated using the following formula: C+I+G+(X-M)
The Aggregate Demand Curve General Price Level The AD curve is downward sloping. A rise in the price level from P to P1 will lead to a fall in the total demand for goods and services from Y to Y1. P1 P AD1 Why? AD Y1 Y National (Real) Output
The Aggregate Demand Curve At higher price levels the total demand for goods and services will be lower. As the price level becomes higher, UK goods become less competitive. Higher imports and lower exports will reduce AD. General Price Level P1 P AD1 AD Y1 Y National (Real) Output = real expenditure and real income
The Aggregate Demand Curve So what happens to the different components of expenditure when prices rise? Consumption? Investment? Government Spending? Imports and Exports? General Price Level P1 P AD1 AD Y1 Y National (Real) Output = real expenditure and real income
The answer! AD falls as prices rise: Because interest rate increases reduce consumption and investment; A loss of competitiveness because of higher prices will reduce exports and increase imports. Now answer question 1 on p.162
Shifts in the AD curve occur when variables other than the price level changes. E.g., a rise in consumption or an injection into the circular flow of income, perhaps from Government spending, will shift the AD curve from AD to AD1. Shifts in the AD Curve General Price Level P1 P AD1 AD Y1 Y National (Real) Output = real expenditure and real income
The curve will shift because … Income tax is cut General Price Level AD shifts right Increase in disposable income will boost consumption P1 P AD1 AD Y1 Y National (Real) Output = real expenditure and real income
So what happens if … Interest rates rise? … or the budget deficit increases? … or we have a weaker Euro and/or dollar? … or prices rise across the board? In what direction is the AD shift … and why? 1. Left … interest rate rise raises the opportunity cost of spending. Consumption and investment both fall. 2.Right … Government spending has risen relative to taxation. The Government provides a bigger net injection to the circular flow. 3.Left … imports become cheaper, exports dearer. Net exports (X-M) fall. 4.AD contracts (but doesn’t shift) … because changes in price levels cause a movement along the AD curve.
Activities Make notes on pages 162 and 163 (Shifts in the AD curve). Answer question 2 on page 163; each part of the question will need a separate explanation (but only one diagram is needed).