Download
1 / 37
390 likes | 596 Views
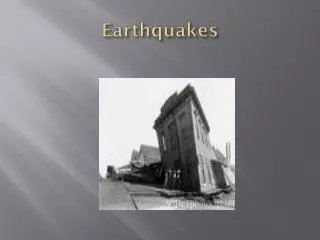
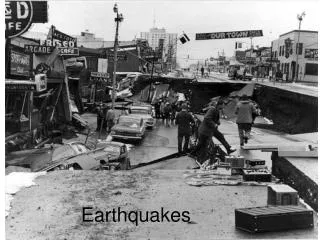
Kobe, Japan 1995 – 5000 deaths. Earthquakes. It is estimated that there are 500,000 detectable earthquakes in the world each year. 100,000 of those can be felt, and 100 of them cause damage. The world's deadliest recorded earthquake occurred in 1557 in

E N D
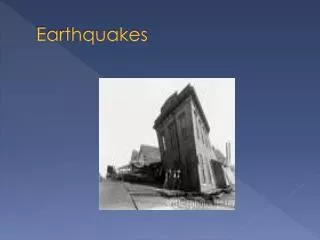
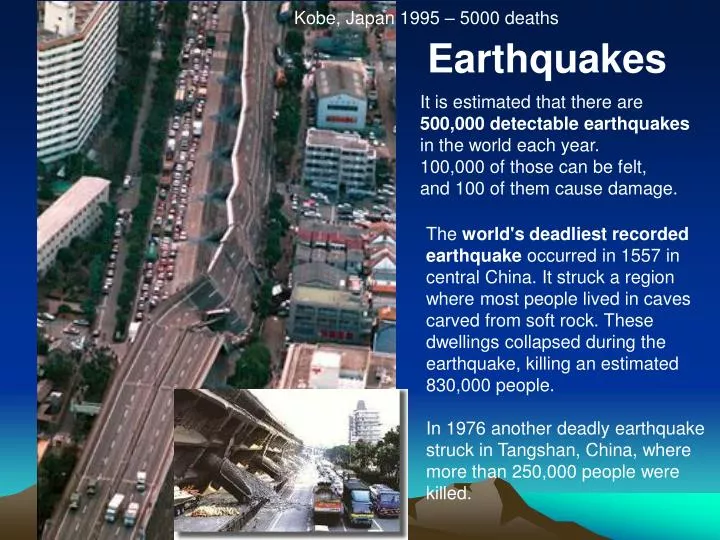
Kobe, Japan 1995 – 5000 deaths Earthquakes It is estimated that there are 500,000 detectable earthquakes in the world each year. 100,000 of those can be felt, and 100 of them cause damage. The world's deadliest recorded earthquake occurred in 1557 in central China. It struck a region where most people lived in caves carved from soft rock. These dwellings collapsed during the earthquake, killing an estimated 830,000 people. In 1976 another deadly earthquake struck in Tangshan, China, where more than 250,000 people were killed.
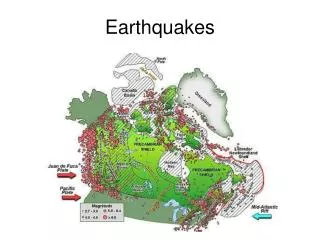
Earthquake epicenters in the U.S.
Seismic risk map for the U.S. Colors on this map show the level of horizontal shaking that have a 1-in-10 chance of being exceeded in a 50-year period. Shaking is expressed as a percentage of g (g is the acceleration of a falling object due to gravity).
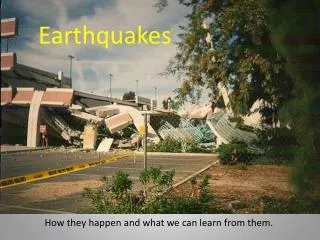
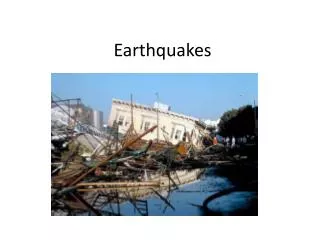
Turkey, August 17, 1999…in 40 seconds $20 billion in losses – 10% of Gross National Product
Listening Team – Turkey, 1999 63,000 damaged buildings, 18,000 deaths, 50,000 injuries, 120,000 families without housing
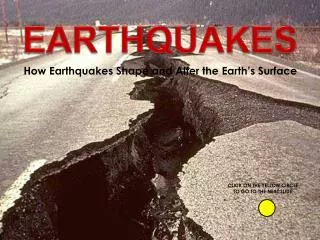
Earthquakes happen every day, every hour somewhere in the world.
95% of seismicity in Hawaii is due to volcanism – magma movement. Other 5% is due to tectonic forces on the seafloor
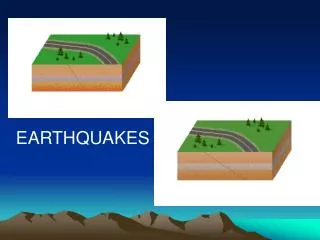
Plate Tectonic framework for earthquakes Convergent, Divergent and Transform Boundaries
Convergent Boundary Divergent Boundary
Earthquakes and Plate Margins Circum-Pacific seismic belt – 81% of worlds largest quakes Alpide Belt – 17% of largest quakes Mid-Atlantic Ridge
Elastic rebound as a cause of earthquakes • Elastic Rebound – • Slow storage of elastic energy • over time (deformation) • 2. Forces holding rocks together are • overcome (displacement by elastic • rebound) Foreshocks – build up of strain Aftershocks – Continued strain release Landforms – scarps, linear features diverted
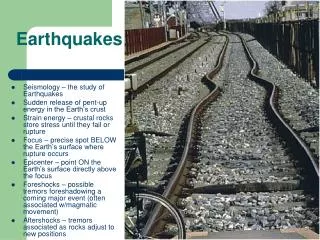
Locating an earthquake Energy is first released at focus, as slippage. This exerts strain along the fault, producing more slippage elsewhere – this propagates as energy
Benioff Zone beneath the Tonga Trench Earthquake foci define the subducting slab.
Two types of wave groups generated – Surface waves (Long Waves) Travel along outer layer of crust at the surface causing ground roll like a water wave and lateral shifting…travel slowly and generate the most damage Body waves (two types) Primary waves (P) – compress and pull (dilate) rocks in the direction of movement, involves changing the volume and shape of material….solids, liquids and gases resist compression and will spring back. Thus they propagate the waves forward.P waves travel through all types of matter Fastest wave Secondary waves (S) – motion is 90 degrees to direction of propagation (up and down), involves only changing the shape of transmitting media…fluid and gas do not resist shape change hence they will not spring back and will not transmit the wave forward. S waves travel only through solids. Second fastest wave
Seismic body waves P Wave - all types of matter, fastest S Wave – solids only, second fastest
Typical Seismograph recordAverage travel-time curves Delay between arrival of S and P waves is proportional to the distance traveled by the waves
Three seismographs each plot a circle of the travel distance calculated by the S-P delay…where three circles intersect is the epicenter
Refraction and reflection of seismic body waves Increased density allows wave to travel faster…causing slow refraction (bending) Refraction also happens suddenly when wave crosses density front. Waves also reflect off density interfaces. Wave front Wave ray
Seismic shadow zones - Measuring Earths Interior P-wave refraction creates a shadow zone S-wave propagation creates a shadow zone P wave shadow zone S wave shadow zone Network of epicenters around Earth’s surface defines the interior zones
Changes in the seismic velocity of P and S waves mark discontinuities at 100 km (the low velocity zone – LVZ), 400 km (base of the upper mantle), 670 km (top of the lower mantle), 2900 km (top of the core), and 4800 km (inner core boundary).
400 discontinuity - broad depression of the surface (green and blue) under most parts of the Pacific and Indian Oceans. Large elevations in the surface (red and yellow) under continental regions such as Eurasia, North America, Australia, Antarctica and parts of Africa. In general 400 km discontinuity correlates well continents and ocean basins. 670 km discontinuity - very different structure from 400 km surface. Notable features: deep depression in western Pacific, Tonga, and South America. Basin depths 25 km from average position of the surface; consistent with effect of subduction in these regions. 2900 discontinuity - at core-mantle boundary reveals broad basin under Indian Ocean and eastern Eurasia; western Africa, southern Indian Ocean, Australia, and western and central Pacific have a high topography related to thermally buoyant regions on core surface
Richter Magnitude – Energy of seismic wave is a function of both amplitude (X) and duration (T). M = log X/T + Y (correction factor)
Table 13.3 – Frequency of Occurrence of Earthquakes since 1900
Table 13.2 Modified Mercalli Intensity Scale I. Not felt except by a very few under especially favorable conditions. II. Felt only by a few persons at rest, especially on upper floors of buildings. III. Felt quite noticeably by persons indoors, especially on upper floors of buildings. Many people do not recognize it as an earthquake. Standing motor cars may rock slightly. Vibrations similar to the passing of a truck. Duration estimated. IV. Felt indoors by many, outdoors by few during the day. At night, some awakened. Dishes, windows, doors disturbed; walls make cracking sound. Sensation like heavy truck striking building. Standing motor cars rocked noticeably. V. Felt by nearly everyone; many awakened. Some dishes, windows broken. Unstable objects overturned. Pendulum clocks may stop. VI. Felt by all, many frightened. Some heavy furniture moved; a few instances of fallen plaster. Damage slight. VII. Damage negligible in buildings of good design and construction; slight to moderate in well-built ordinary structures; considerable damage in poorly built or badly designed structures; some chimneys broken. VIII. Damage slight in specially designed structures; considerable damage in ordinary substantial buildings with partial collapse. Damage great in poorly built structures. Fall of chimneys, factory stacks, columns, monuments, walls. Heavy furniture overturned. IX. Damage considerable in specially designed structures; well-designed frame structures thrown out of plumb. Damage great in substantial buildings, with partial collapse. Buildings shifted off foundations. X. Some well-built wooden structures destroyed; most masonry and frame structures destroyed with foundations. Rails bent. XI. Few, if any (masonry) structures remain standing. Bridges destroyed. Rails bent greatly. XII. Damage total. Lines of sight and level are distorted. Objects thrown into the air.