Download
1 / 18
180 likes | 184 Views
This research focuses on constructing and evaluating metrics to aid in the analysis and decision making process of identifying network incidents in network telescope datasets. Approaches include automated identification through mathematical modeling and manual identification through observation.

E N D
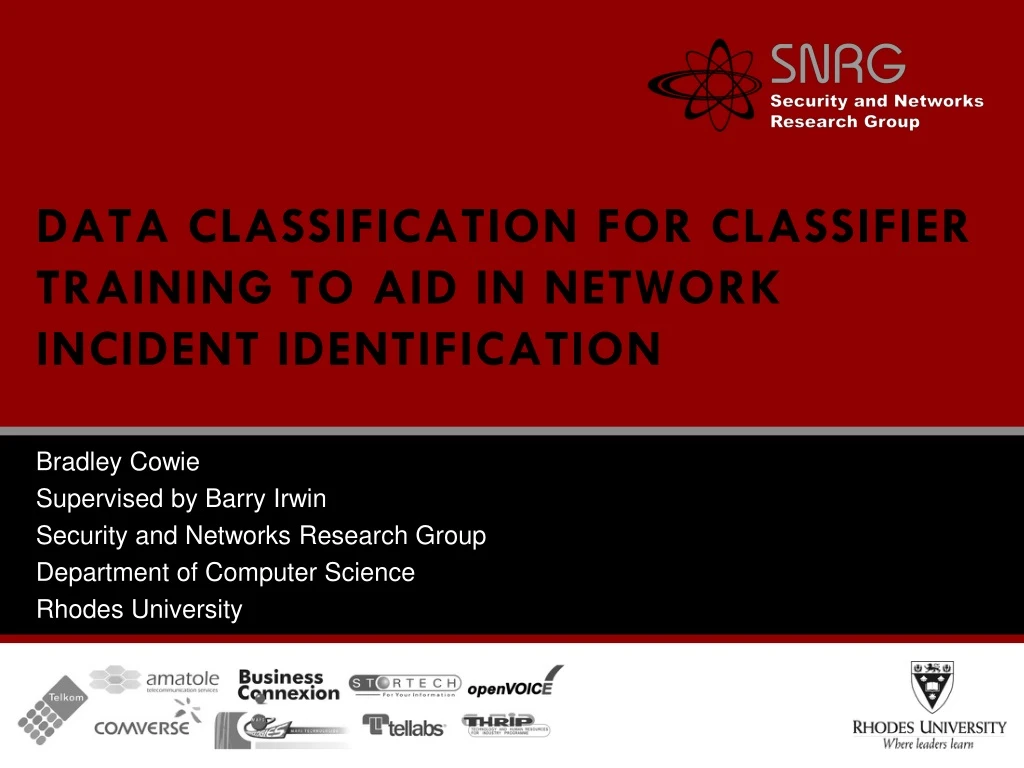
DATA CLASSIFICATION FOR CLASSIFIER TRAINING TO AID IN NETWORK INCIDENT IDENTIFICATION Bradley Cowie Supervised by Barry Irwin Security and Networks Research Group Department of Computer Science Rhodes University
Introduction Introduction Background Problem Statement Approach Results Conclusion Questions
Network Telescopes (aka Darknets) Background • What are they ? • Network telescopes are monitors that log traffic that is destined for a certain IP space on which no legitimate hosts belong. We can conclude that traffic received is either malicious in nature or due to incorrect configuration. • Why ? • Network telescopes provide a way of observing the anomalous traffic on the Internet. This is useful for researchers studying the trending of malicious activity on the Internet. Allowing for early warning systems to be devised to allow suitable reactions to current attacks/incidents. • Who • The majority of the research is conducted by CAIDA. Other research institutions include the Internet Motion Sensor, Team Crymu and an assortment of other universities. The majority of the research in network telescopes focuses on • building scalable frameworks to allow for efficient querying of information from • network telescopes, anomaly monitoring and Internet mapping
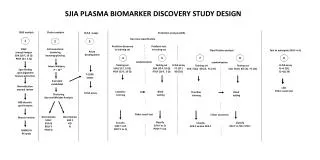
Bradley Cowie • Simple Network Diagram of a Network Telescope Background Network Telescope Structure As there are no legitimate hosts on the IP space assigned to the network telescope. It can be assumed that all traffic received is either malicious, anomalous or due to incorrect configuration
Problem Statement • Overall : • To aid in the analysis of the traffic received by network telescope by • constructing and evaluating a number of metrics. These metrics should aid in • in the analysis and decision making process of identifying network incidents. • Why ? • Network telescopes provide a large quantity of information for analysts to • consider. Especially if all the various divisions are considered such as the • number of ports for UDP and TCP. It is quite possible that this can lead to • information overload and poor decision making. • For this particular talk : • To consider a number of ways to identify network incidents in network • telescope datasets • Why ? • In order to evaluate the usefulness of the metrics at identifying incidents we need to identify where incidents occur in our datasets.
Approaches Two main approaches are detailed : Automated approach : Identification through mathematical modelling Identification through deviations from normality Manual Approach Through observation
Automated Approach Identification through mathematical modelling : It has been established that for certain cases mathematical models describe the growth in infected hosts due to viral infections. It is conceivable that a system could be constructed to identify these sorts of models. Attempted System : A naive implementation to this technique was attempted by constructing a feed-forward network that had been optimized for shape identification. Said system was modified from a neural network that was designed to identify shapes.
Automated Approach Results : Due to the complex nature of the traffic received said system failed to produce any results of significance. The highly fluxuating nature of the number of unique source IP’s is illustrated in the graph below. Conclusions : A more complex approach is required to identify growth types using network telescope data in an automated sense.
Identification through deviations from normality Overview : This approach attempts to define normal values for measures and then identify where these values are grossly exceeded. The definition of grossly exceeds is tricky. One approach to this is make use of bands that define the upper and lower limits that we expect a quantity. One way to approach this is to make use of Bollinger Bands. The upper band is defined as Moving Average + kσ with the lower band defined as Moving Average - kσ .
Identification through deviations from normality Standard Bollinger bands unfortunately don’t seem to identify major incidents such as the outbreak of Conficker. Further there are far too many signals generated. Investigating each of these would be lengthy. We need to optimize the parameters (K and the length of the moving of average). This comes back to our original problem ... Alternatively we can attempt to identify incidents by observation. This is an adhoc type process that involves considering a number of statistics and noticing anomalies by hand. These “incidents” are then verified by comparing them against CVE and the wildlist to see if such an incident occurred during that time frame. This work is still currently in progress ...
Line graph of traffic observed (as counts) This graph shows the trend of packets counts received between January 2006 and September 2009. It illustrates how the nature of traffic received changed due to the spread of the Conficker virus (October 2008)
Ratio’s of total traffic (TCP) The ratio that each of the top 4 ports and other ports make up of the total traffic for the years 2005-2009 is shown. Between 2008 and 2009 there is a shift from other ports making up the most traffic to port 445.
Manual Approach • This follows the reverse of the methodology taken in the automated approach. • Here the researcher attempt to find a list of know vulnerabilities/exploits/viruses in the datasets. • A sample of this is identifying DDoS attacks. Often DDoS based attacks spoof IP address as the source IP’s to there attacks. Thus it is possible to observe these sorts of attacks when an attacker happens to spoof IP’s that belong to the network telescope. This causes ICMP type 11 messages to be returned to the network telescope. • This work is still currently in progress ...
Appearance of ICMP type 11 traffic Plot depicting the sudden appearance of ICMP Type 11 Traffic during the 17th and 18th of February 2008. It is suspected that this is DDoS backscatter.
Conclusion • Some preliminary work has been completed to classify some incidents in our network telescope dataset. Further work is needed to create a well defined set of data points defining the occurrences of incidents in the data. • Future work : • Application of technical analysis indicators to the datasets • Optimization of metrics using neural networks and GA’s