Download
1 / 10
100 likes | 196 Views
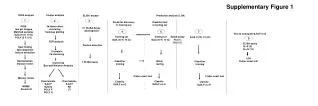
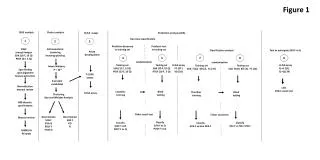
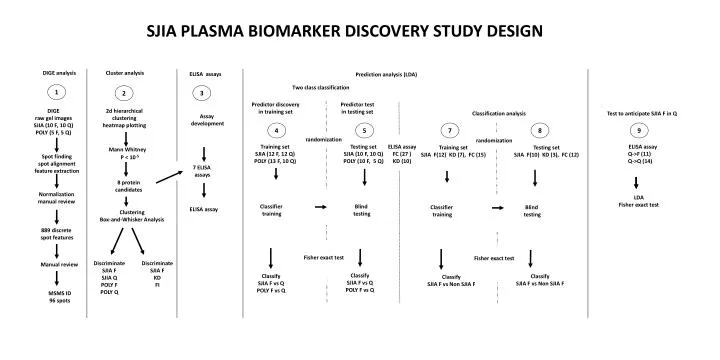
SJIA PLASMA BIOMARKER DISCOVERY STUDY DESIGN. DIGE analysis. Cluster analysis. ELISA assays. Prediction analysis (LDA). Two class classification. 1. 3. 2. Predictor discovery in training set. Predictor test in testing set. DIGE raw gel images SJIA ( 10 F , 10 Q) POLY (5 F, 5 Q).

E N D
SJIA PLASMA BIOMARKER DISCOVERY STUDY DESIGN DIGE analysis Cluster analysis ELISA assays Prediction analysis (LDA) Two class classification 1 3 2 Predictor discovery in training set Predictor test in testing set DIGE raw gel images SJIA (10 F, 10 Q) POLY (5 F, 5 Q) 2d hierarchical clustering heatmap plotting Test to anticipate SJIA F in Q Classification analysis Assay development 4 5 9 7 8 randomization randomization Training set SJIA (12 F, 12 Q) POLY (13 F, 10 Q) Testing set SJIA (10 F, 10 Q) POLY (10 F, 5 Q) ELISA assay FC (27 ) KD (10) ELISA assay Q->F (11) Q->Q (14) Training set SJIA F(12) KD (7), FC (15) Testing set SJIA F(10) KD (3), FC (12) Mann Whitney Spot finding spot alignment feature extraction P < 10-5 7 ELISA assays 8 protein candidates Normalization manual review LDA Fisher exact test Classifier training Blind testing Classifier training Blind testing ELISA assay Clustering Box-and-Whisker Analysis 889 discrete spot features Fisher exact test Fisher exact test Discriminate SJIA F SJIA Q POLY F POLY Q Discriminate SJIA F KD FI Manual review Classify SJIA F vs Q POLY F vs Q Classify SJIA F vs Q POLY F vs Q Classify SJIA F vs Non SJIA F Classify SJIA F vs Non SJIA F MSMS ID 96 spots
SJIA F Q Two dimensional DIGE analysis identified 96 protein spots differentially expressed between SJIA flare and quiescence SJIA POLY POLY F Q F Q F Q A B C
SJIA F Q DIGE analysis reveals a seven protein biomarker panel in plasma clearly differentiating SJIA flare from quiescence SJIA POLY POLY F Q F Q F Q A B C D Relative expression 4 SAP SAP SJIA POLY 3 F Q F Q SAA SAA MRP8 MRP8 MRP14 MRP14 2 HP HP 1 CRP CRP 0 APOA1 APOA1 A2M APOA1 CRP HP MRP14 MRP8 SAA SAP A2M A2M
ELISA analysis validates the seven protein biomarker panel in plasma E B A C D Training set n = 24 Testing set n = 20 Training Testing SJIA F vs. Q SJIA • Biomarker panel • of 7 members • A2M • APO AI • CRP • HP • MRP8/MRP14 • SAA • SAP SJIA Clinical diagnosis Clinical diagnosis SJIA F SJIA Q SJIA F SJIA Q F Q F Q 12 12 10 10 n = n = Sensitivity LDA Testing Classified as F Classified as F 11 1 8 3 Predicted probabilities Classified as Q Classified as Q 1 11 2 7 ESR : AUC=0.86 91.6% 91.6% 80% 70% Percent Agreement with clinical diagnosis + - Percent Agreement with clinical diagnosis + - panel : AUC=0.82 91.6% 75% CRP : AUC=0.58 Overall P = 1.0 X 10⁻³ Overall P = 7 X 10⁻² Patient samples 1- Specificity
ELISA analysis invalidates the seven protein biomarker panel in POLY plasma D A B C Training set n = 23 Testing set n = 15 Training Testing POLY F vs. Q POLY POLY Clinical diagnosis Clinical diagnosis PF PQ PF PQ F Q F Q 13 10 10 5 n = n = Sensitivity LDA Testing Classified as F Classified as F 10 5 3 0 Predicted probabilities Classified as Q Classified as Q 3 5 7 5 76.9% 50% 30% 100% Percent Agreement with clinical diagnosis + - Percent Agreement with clinical diagnosis + - panel : AUC=0.64 65.2% 53.3% CRP : AUC=0.64 Overall P = 0.41 Overall P = 0.20 Patient samples 1- Specificity
ELISA analysis shows the ineffectiveness of seven protein plasma biomarker panel in prognosis of impending SJIA flare C A B Training set n = 25 SJIA QF vs. QQ SJIA Training Clinical diagnosis QF QQ QQ QF 11 14 n = Sensitivity LDA Predicted probabilities Classified as QF 6 2 Classified as QQ 5 12 ESR : AUC=0.60 54.5% 85.7% Percent Agreement with clinical diagnosis + - panel : AUC=0.78 72% CRP : AUC=0.59 Overall P = 0.08 Patient samples 1- Specificity
DIGE analysis shows that seven protein SJIA flare panel in plasma clearly differentiating SJIA flare from confounding Kawasaki and febrile illness B C SJIA F KD FC SJIA F Data set n = 34 KD FC 10 12 12 SJIA A F KD FC SJIA F NOT-SJIA F Clinical diagnosis 10 24 n = 4 SAP Unsupervised clustering SAA MRP8 3 MRP14 Clustered as SJIA F 7 1 Clustered as NOT-SJIA F HP 3 23 Protein quantity 2 CRP 70% 95.8% - Percent Agreement with clinical diagnosis + APOA1 88.2% Overall P = 1.6 X 10⁻⁴ 1 A2M 0 A2M APOA1 CRP HP MRP14 MRP8 SAA SAP
ELISA analysis validates the utility of the seven protein SJIA flare panel in plasma to discriminate SJIA flare from confounding Kawasaki and febrile illness A B C Training set n = 34 Testing set n = 25 SJIA F SJIA F KD FC Training Testing KD FC 10 3 12 12 7 15 FC KD SJIA F FC KD SJIA F SJIA F NOT SJIA F SJIA F NOT SJIA F Clinical diagnosis Clinical diagnosis 12 22 10 15 n = n = LDA Testing Predicted probabilities Clustered as SJIA F 12 0 9 0 Clustered as NOT SJIA F 0 22 1 15 100% 100% 90% 100% Percent Agreement with clinical diagnosis + - Percent Agreement with clinical diagnosis + - Patient samples 100% 93.3% Overall P = 7.4X 10⁻⁷ Overall P = 4.9 X 10⁻⁶
Agilent protein array analysis reveals a four protein SJIA flare panel in plasma clearly differentiating SJIA flare from quiescence A E B C D Training set n = 39 Bootstrap set n = 73 Training Bootstrap confirmation • Biomarker panel • of 7 members • TIMP1 • MMP9 • IL18 • RANTES SJIA SJIA Clinical diagnosis Clinical diagnosis SF SQ SF SQ F Q F Q SJIA F vs. Q 16 23 34 39 n = n = Sensitivity LDA Testing Predicted probabilities Classified as F Classified as F 11 3 29 7 Classified as Q Classified as Q 5 20 5 32 Training : AUC=0.84 68.8% 87% 85.3% 82.1% Percent Agreement with clinical diagnosis + - Percent Agreement with clinical diagnosis + - 79.5% 83.5% Patient samples Bootstrap : AUC=0.90 Overall P = 6.0X 10⁻⁴ Overall P = 5.9 X 10⁻⁹ 1- Specificity
Agilent protein array analysis reveals a four protein POLY flare panel in plasma clearly differentiating POLY flare from quiescence A D A B C Training set n = 13 Bootstrap set n = 16 Training Bootstrap confirmation • Biomarker panel • of 4 members • TIMP2 • IGFBP-3 • IGFBP-6 • VCAM-1 POLY POLY Clinical diagnosis Clinical diagnosis PF PQ PF PQ F Q F Q 6 7 6 10 n = n = Sensitivity POLY F vs. Q LDA Testing Classified as F Classified as F 5 1 5 2 Predicted probabilities Classified as Q Classified as Q 0 6 1 8 Training: AUC=1 100% 85.7% 83.3% 80% Percent Agreement with clinical diagnosis + - Percent Agreement with clinical diagnosis + - Bootstrap: AUC=0.91 84.6% 81.25% Overall P = 0.01 Overall P = 0.03 Patient samples 1- Specificity