Download
1 / 17
170 likes | 277 Views
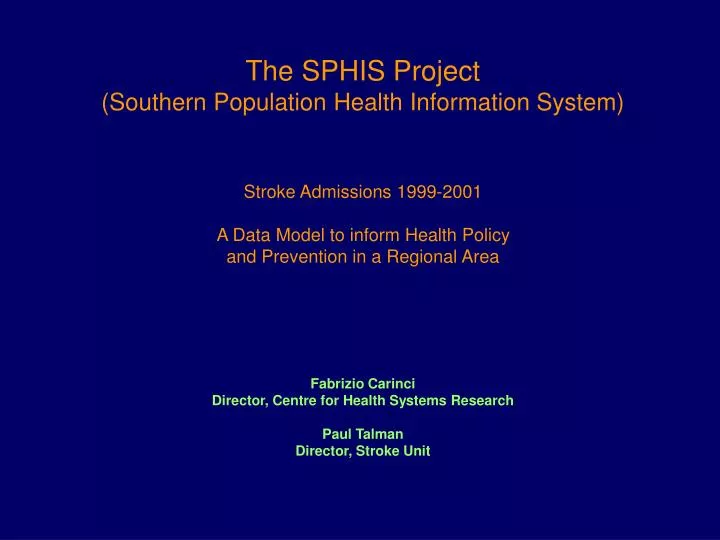
The SPHIS Project (Southern Population Health Information System) Stroke Admissions 1999-2001 A Data Model to inform Health Policy and Prevention in a Regional Area Fabrizio Carinci Director, Centre for Health Systems Research Paul Talman Director, Stroke Unit.

E N D
The SPHIS Project(Southern Population Health Information System)Stroke Admissions 1999-2001A Data Model to inform Health Policy and Prevention in a Regional AreaFabrizio CarinciDirector, Centre for Health Systems ResearchPaul TalmanDirector, Stroke Unit
The SH 1999-2001 Stroke Cohort: Flow Chart Stroke Admissions 1st July 1998 –30th June 2001 - N=4,032 (1.1%) First Admission Yes No Stroke Patients N=3,356 Stroke readmissions N=676 (17%) COHORT HISTORY Select all admissions (any diagnosis) with same UR_NO and date of admission>date of discharge first stroke admission (N=8,287) X Deaths at First Admission: 316/3356 (9%) X Survivors Died at Readmission: 141/3040 (5%) Patients Survivors Readmitted: 1194/3040 (39%) X Survivors Never Readmitted: 1705/3040 (56%) Admissions 30/06/2001 1/06/1998 TIME
Geographical Variability 3-Year Overall LOS per Subject Dandenong Hospital 80 60 Stroke Patients x 1.000 Sum LOS per Subject (N=3324) 40 0 0-1 1.1-2.9 3-4.9 5.1-6.2 6.9-7.5 20 0 Postcodes
Practice Variability LOS>26 (75%) by Discharge Unit OVERALL 3356 NCST 1036 MDGA 716 MCED 281 NJUN 262 MDED 197 121 MSGA 115 NCBS MSED 91 SCVS 91 NCUN 63 SDVS 62 50 MCGA 37 SJVS 31 MDGG 29 MSGP 0 10 20 30 40 50 60 70 80 90 100 FREQUENCY LOS>26 No Yes
SH 1999-2001 - Event Rates by Department of Discharge(Mortality, Readmissions and LOS observed anywhere) Mortality Readmission ALL PATIENTSLOS > 26 Emergency Clayton 2.9 1.9 0.6 1.3 28.4 8.5 Emergency Dandenong 3.0 2.0 0.9 1.1 26.9 6.1 Medicine Clayton 31.0 16.9 8.1 8.8 51.5 4.4 Medicine Dandenong 18.4 13.1 6.0 7.1 44.9 3.3 Neurosciences (incl. NCST) 15.1 6.1 4.3 1.8 32.7 3.5 NCST only 9.6 10.5 9.9 0.6 3.5 0.5 Surgery Clayton 15.8 8.4 3.9 4.5 43.8 2.5 Surgery Dandenong 16.4 7.6 3.8 4.8 38.2 2.8 Other 6.3 1.9 0.8 1.1 27.2 3.2 Overall 1ST Adm.Readm. Overall 7 days Mortality Readmission STROKE PATIENTSLOS > 26 Emergency Clayton 7.7 9.0 4.4 4.6 35.5 11.6 Emergency Dandenong 8.2 4.2 3.1 1.1 30.5 2.1 Medicine Clayton 41.3 40.5 21.3 18.6 59.3 5.1 Medicine Dandenong 31.7 18.2 6.4 11.8 56.8 5.0 Neurosciences 27.3 14.3 10.8 3.5 43.5 4.4 Surgery Clayton 14.2 4.4 - 4.4 39.6 3.3 Surgery Dandenong 3.2 3.2 - 3.2 25.8 4.8 Other 24.7 12.9 7.5 5.4 36.7 4.6 Overall 1st Adm. Readm. Overall 7 days
Modelling Outcomes= Subject-Level Adjustments + Practice-Level Adjustments + Subject Level Covariates + Practice-Level Risk Covariates + Population-Level Factors
SH Stroke Patients 1999-2001Outcome: Overall LOS³26 Cox Regression Results (Events / N = 829 / 3,321) Variable (HR;95% CI) Age > 65 (1.443;1.198-1.738) Male (0.902;0.779-1.045) Respiratory (1.13;0.864-1.477) Cancer (1.116;0.741-1.683) History of Comorbidity At First Stroke Admission Heart Disease (1.258;0.998-1.585) Circulatory (1.115;0.889-1.398) Diabetes (1.202;0.932-1.549) Renal (1.476;1.024-2.128) TIA (0.422;0.323-0.55) Stroke Diagnosis Hemorragic (1.355;1.106-1.661) Cerebral Infarction (0.86;0.71-1.043) Discharge Hospital Clayton (1.5;1.188-1.893) Dandenong (1.448;1.134-1.85) Neurosciences (0.77;0.614-0.965) Emergency Clayton (0.436;0.268-0.711) Discharge Unit Emergency Dandenong (0.586;0.346-0.989) Separated/Divorced/Widow (1.238;1.06-1.446) Discharge Destination Kingston (3.657;3.099-4.315) Hampton (5.111;4.038-6.469) Procedures Carotid Endarterectomy (0.245;0.132-0.454) CT Scan (1.217;1.034-1.432) Postcodes Springvale (3171) (1.543;1.088-2.188) 0.01 0.25 0.5 1 2 5 10 Predictive at Subject level Decreased Risk Increased Risk HAZARD RATIO
SH Stroke Patients 1999-2001Outcome: Overall Mortality Cox Regression Results (Events / N = 435 / 3,321) Variable (HR;95% CI) Age > 65 (2.59 ; 1.96 - 3.44) Male (0.96 ; 0.79 - 1.16) Respiratory (1.29 ; 0.90 - 1.86) History of Comorbidity At First Stroke Admission Cancer (1.44 ; 0.82 - 2.55) Heart Disease (0.98 ; 0.69 - 1.39) Circulatory (1.18 ; 0.83 - 1.67) Diabetes (0.96 ; 0.66 - 1.39) Renal (1.56 ; 0.98 - 2.47) TIA (0.17 ; 0.11 - 0.25) Stroke Diagnosis Hemorragic (2.67 ; 2.11 - 3.37) Cerebral Infarction (0.94 ; 0.72 - 1.22) Discharge Hospital Clayton (2.39 ; 1.67 - 3.41) Dandenong (1.36 ; 0.96 - 1.93) Neurosciences (0.57 ; 0.41 - 0.78) Discharge Unit Emergency Clayton (0.57 ; 0.34 - 0.94) Carer Unknown or NA (3.81 ; 1.42 -10.25) Planned Admission (0.38 ; 0.23 - 0.63) Hospital Transfer (0.24 ; 0.18 - 0.31) Carotid Endarterectomy (0.19 ; 0.07 - 0.49) Procedures Magnetic Resonance (0.49 ; 0.32 - 0.73) 0.01 0.25 0.5 1 2 5 10 Decreased Risk Increased Risk HAZARD RATIO
SH Stroke Patients 1999-2001Outcome: In-hospital Mortality at First Admission Logistic Regression Results (Events / N=316 / 3,356) Variable (OR;95% CI) Age > 65 (2.40 ; 1.70 - 3.38) Male (1.02 ; 0.79 - 1.31) Respiratory (1.19 ; 0.70 - 2.01) History of Comorbidity At First Stroke Admission Cancer (1.23 ; 0.53 - 2.89) Heart Disease (1.06 ; 0.66 - 1.71) Circulatory (0.75 ; 0.46 - 1.23) Diabetes (1.07 ; 0.64 - 1.81) Renal (2.15 ; 1.11 - 4.17) TIA (0.04;0.015-0.11) Stroke Diagnosis Hemorragic (3.59 ;2.65 - 4.87) Cerebral Infarction (0.84 ; 0.59 - 1.17) Discharge Hospital Clayton (1.87 ; 1.25 - 2.78) Dandenong (1.54 ;1.01 -2.35) Emergency Clayton (0.36 ; 0.19 - 0.68) Discharge Unit Medicine Clayton (1.95 ; 1.02 - 3.70) NE Asian / N American (1.57 ; 1.05 - 2.33) Planned Admission (0.28 ; 0.14 - 0.56) Carotid Endarterectomy (0.09 ; 0.01 - 0.68) CT Scan (0.68 ; 0.48 - 0.95) Procedures CT Scan Intrav. (0.38 ; 0.23 - 0.64) Magnetic Resonance (0.26 ; 0.15 - 0.46) 0.01 0.25 0.5 1 2 5 10 Decreased Risk Increased Risk ODDS RATIO Predictive at Subject level
SH Stroke Patients 1999-2001Outcome: Overall Readmissions Cox Regression Results (Events / N =1,335 / 3,027) Variable (HR;95% CI) Age > 65 (1.26 ; 1.10 - 1.43) Male (0.96 ; 0.86 - 1.07) Respiratory (1.22 ; 0.98 - 1.51) History of Comorbidity At First Stroke Admission Cancer (1.30 ; 0.94 - 1.79) Heart Disease (1.17 ; 0.97 - 1.42) Circulatory (1.07 ; 0.89 - 1.30) Diabetes (1.09 ; 0.88 - 1.34) Renal (1.27 ; 0.93 - 1.74) TIA (0.83 ; 0.71 - 0.98) Stroke Diagnosis Hemorragic (1.04 ; 0.86 - 1.26) Cerebral Infarction (0.95 ; 0.81 - 1.10) Discharge Hospital Clayton (1.88 ; 1.57 - 2.25) Dandenong (6.54 ; 2.06 -20.75) Neurosciences (0.80 ; 0.69 - 0.94) Discharge Unit Emergency Dandenong (0.23 ; 0.07 - 0.75) Medicine Dandenong (0.31 ; 0.10 - 0.98) Surgery Dandenong (0.22 ; 0.06 - 0.76) NE Asian / N American (0.59 ; 0.46 - 0.76) Discharge Destination Kingston (2.42 ; 2.09 - 2.80) Hampton (3.53 ; 2.91 - 4.29) Carotid Endarter. (0.65 ; 0.46 - 0.92) Procedures CT Scan (1.19 ; 1.05 - 1.35) Bentleigh East (3165) (1.37 ; 1.04 - 1.80) Postcode Oakleigh South (3167) (1.65 ; 1.19 - 2.28) Springvale (3171) (1.52 ; 1.16 - 1.99) 0.01 0.25 0.5 1 2 5 10 Decreased Risk Increased Risk Predictive at Subject level HAZARD RATIO
SH Stroke Patients 1999-2001Outcome: Readmissions within 7 days Logistic Regression Results (Events / N = 153 / 3,040) Variable (OR;95% CI) Age > 65 (0.92 ; 0.61 – 1.37) Male (1.04 ; 0.74 - 1.46) Respiratory (0.68 ; 0.31 - 1.46) Cancer (1.57 ; 0.59 - 4.15) History of Comorbidity At First Stroke Admission Heart Disease (1.62 ; 0.88 - 3.01) Circulatory (0.86 ; 0.45 - 1.64) Diabetes (0.66 ; 0.31 - 1.40) Renal (1.54 ; 0.58 - 4.10) TIA (1.10 ; 0.69 - 1.77) Stroke Diagnosis Hemorragic (0.85 ; 0.47 - 1.56) Cerebral Infarction (0.88 ; 0.55 -1.41) Discharge Hospital Clayton (1.28 ; 0.74 - 2.19) Dandenong (1.07 ; 0.60 - 1.90) Discharge Unit Emergency Clayton (2.25 ; 1.31 - 3.86) Discharge Destination Hampton (1.86 ; 1.04 - 3.34) Hospital Transfer (3.06 ; 2.04 - 4.58) Procedures CT Scan Intrav. (0.52 ; 0.27 - 0.98) Postcode Dandenong(3175) (2.37 ; 1.34 - 4.20) 0.01 0.25 0.5 1 2 5 10 Decreased Risk Increased Risk ODDS RATIO Predictive at Subject level
OutlineStrategies for Stroke Care and Prevention • Targets to reduce the impact of Overall Mortality: • Aged patients • Subjects with Hemorragic diagnoses • Assess presence of Carer at home • Targets to reduce the impact of Mortality at First Admission: • Aged patients • Subjects with Hemorragic diagnoses • Patients born in North-East Asia or North America • Discharges from Medicine Clayton • Targets to reduce the impact of Overall Readmissions: • Aged patients • Subjects with Hemorragic diagnoses • Residents in Springvale, Bentleigh East, Oakleigh • Targets to reduce the impact of Readmissions within 7 days after first discharge: • Discharges from Emergency Clayton • Residents in Dandenong • Targets to reduce the impact of Long Stay: • Patients Separated, divorced or widowed • Aged patients • Subjects with Hemorragic diagnoses • Residents in Springvale
Cox Regression Results (Events / N = 11,719 / 174,614) Variable (HR;95% CI) Age > 65 (1.65 ; 1.57 - 1.73) Male (1.09 ; 1.05 - 1.13) Respiratory (1.84 ; 1.76 - 1.91) History of Comorbidity At First Stroke Admission Cancer (2.16 ; 2.06 - 2.27) Heart Disease (1.27 ; 1.21 - 1.33) Circulatory (1.63 ; 1.55 - 1.71) Cerebrovascular (1.58 ; 1.49 - 1.68) Diabetes (1.10 ; 1.05 - 1.16) Renal (2.07 ; 1.97 - 2.18) Discharge Hospital Clayton (1.12 ; 1.06 - 1.17) Dandenong (0.53 ; 0.49 - 0.57) NE Asian / N American (0.65 ; 0.59 - 0.71) Separated/Divorced/Widow (1.44 ; 1.38 - 1.51) Carer Unknown or NA (1.16 ; 1.06 - 1.27) Stroke Diagnosis TIA (1.65 ; 1.50 - 1.81) Cerebral Infarction (0.73 ; 0.60 - 0.89) Planned Admission (1.52 ; 1.45 - 1.60) Discharge Destination Kingston (2.39 ; 2.20 - 2.59) Hampton (6.30 ; 5.58 - 7.10) Waiting List (0.29 ; 0.27 - 0.31) Hospital Transfer (2.24 ; 2.12 - 2.38) Neurosciences (0.58 ; 0.53 - 0.63) Emergency Clayton (0.36 ; 0.33 - 0.39) Emerg. Dandenong (0.80 ; 0.72 - 0.90) Discharge Unit Medicine Clayton (1.09 ; 1.01 - 1.19) Medicine Dandenong (1.59 ; 1.45 - 1.74) Surgery Clayton (0.78 ; 0.63 - 0.96) Surgery Dandenong (2.42 ; 1.90 - 3.09) Carotid Endarter. (0.33 ; 0.17 - 0.63) Procedures CT Scan (1.37 ; 1.27 - 1.47) CT ScanIntrav. (1.33 ; 1.17 - 1.45) Mount Waverley(3149) (0.81 ; 0.70 - 0.94) Glen Waverley(3150) (0.76 ; 0.67 - 0.86) Postcodes Carnegie(3163) (0.79 ; 0.69 - 0.91) Springvale(3171) (1.19 ; 1.07 - 1.31) Noble Park(3174) (1.21 ; 1.11 - 1.31) Dandenong(3175) (1.38 ; 1.29 - 1.49) 0.01 0.25 0.5 1 2 5 10 Decreased Risk Predictive at Subject level Increased Risk HAZARD RATIO SH All Patients 1999-2001Outcome:Overall LOS>26 (75% Stroke)
Cox Regression Results (Events / N = 4,314 / 174,614) Variable (HR;95% CI) Age > 65 (3.77 ; 3.45 - 4.12) Male (1.19 ; 1.12 - 1.27) Respiratory (2.09 ; 1.95 - 2.23) History of Comorbidity At First Stroke Admission Cancer (3.52;3.28 - 3.77) Heart Disease (2.12 ; 1.96 - 2.28) Circulatory (1.23 ; 1.14 - 1.32) Cerebrovascular (1.72 ; 1.58 - 1.88) Diabetes (0.85 ; 0.79 - 0.91) Renal (2.40 ; 2.23 - 2.58) Discharge Hospital Clayton (1.47 ; 1.35 - 1.61) Dandenong (0.99 ; 0.87 - 1.13) NE Asian / N American (1.46 ; 1.31 - 1.63) Married (1.19 ; 1.09 - 1.31) Separated, Widowed, Divorced (1.43 ; 1.29 - 1.58) Carer Unknown or NA (2.83 ; 2.28 - 3.52) Stroke Diagnosis TIA (0.72 ; 0.58 - 0.89) Hemorragic (3.94 ; 3.15 - 4.93) Planned Admission (1.13 ; 1.03 - 1.23) Discharge Destination Kingston (0.50 ; 0.26 - 0.93) Waiting List (0.31 ; 0.27 - 0.36) Hospital Transfer (0.67 ; 0.61 - 0.74) Emergency Clayton (0.68 ; 0.60 - 0.77) Discharge Unit Emergency Dandenong (1.24 ; 1.06 - 1.45) Medicine Clayton (1.17 ; 1.04 - 1.33) Medicine Dandenong (1.60 ; 1.40 - 1.83) Surgery Clayton (1.64 ; 1.21 - 2.21) Surgery Dandenong (2.59 ; 1.84 - 3.65) Carotid Endarter. (0.19 ; 0.07 - 0.51) Procedures CT Scan (1.647;1.482-1.83) CT Scan Intrav. (1.34 ; 1.14 - 1.59) Magnetic Resonance (0.66 ; 0.50 - 0.88) Springvale (3171) (1.21 ; 1.04 - 1.41) Postcodes Noble Park (3174) (1.23 ; 1.09 - 1.40) Dandenong (3175) (1.18 ; 1.06 - 1.32) 0.01 0.25 0.5 1 2 5 10 Predictive at Subject level Decreased Risk Increased Risk HAZARD RATIO SH All Patients 1999-2001Outcome: Overall In-hospital Mortality
Logistic Regression Results (Events / N = 1,938 / 176,148) Variable (OR;95% CI) Age > 65 (5.78 ; 5.07 - 6.60) Male (1.29 ; 1.16 - 1.42) Respiratory (1.44 ; 1.30 - 1.60) Cancer (2.03 ; 1.78 - 2.32) History of Comorbidity At First Stroke Admission Heart Disease (2.22 ; 1.98 - 2.48) Circulatory (0.88 ; 0.79 - 0.98) Cerebrovascular (1.30 ; 1.11 - 1.51) Diabetes (0.67 ; 0.59 - 0.76) Renal (1.72 ; 1.51 - 1.96) Clayton (1.76 ; 1.53 - 2.03) Discharge Hospital Dandenong (0.91 ; 0.74 - 1.13) NE Asian / N American (2.23 ; 1.94 - 2.57) Separated/Divorced/Widow (1.17 ; 1.05 - 1.31) TIA (0.48 ; 0.35 - 0.68) Stroke Diagnosis Hemorragic (5.70 ; 4.15 - 7.82) Waiting List (0.11 ; 0.08 - 0.16) Neurosciences (1.63 ; 1.32 - 2.02) Emergency Clayton (0.31 ; 0.25 - 0.39) Emergency Dandenong (1.28 ; 1.00 - 1.65) Medicine Clayton (1.35 ; 1.12 - 1.63) Discharge Unit Medicine Dandenong (2.53 ; 2.02 - 3.16) Surgery Clayton (2.00 ; 1.26 - 3.17) Surgery Dadenong (4.30 ; 2.49 - 7.43) CT Scan (2.33 ; 2.01 - 2.71) Procedures CT Scan Intrav. (1.48 ; 1.13 - 1.92) Magnetic Resonance (0.47 ; 0.31 - 0.72) 0.01 0.25 0.5 1 2 5 10 Decreased Risk Increased Risk Predictive at Subject level ODDS RATIO SH All Patients 1999-2001Outcome: In-hospital Mortality at First Admission
Cox Regression Results (Events / N = 49,461 / 172,755) Variable (HR;95% CI) Age > 65 (0.94 ; 0.92 - 0.97) Male (0.92 ; 0.91 - 0.94) Respiratory (1.56 ; 1.52 - 1.59) History of Comorbidity At First Stroke Admission Cancer (1.97 ; 1.91 - 2.02) Heart Disease (1.29 ; 1.26 - 1.32) Circulatory (1.27 ; 1.24 - 1.30) Stroke (1.24 ; 1.19 - 1.30) Diabetes (1.13 ; 1.10 - 1.16) Renal (1.31 ; 1.27 - 1.36) Discharge Hospital Clayton (1.36 ; 1.32 - 1.39) Dandenong (1.15 ; 1.12 - 1.18) NE Asian / N American (0.66 ; 0.63 - 0.69) Married (1.35 ; 1.32 - 1.38) Separated/Divorced/Widow (1.37 ; 1.33 - 1.41) Carer Unknown or NA (1.04 ; 1.01 - 1.08) Stroke Diagnosis TIA (1.31 ; 1.24 - 1.39) Cerebral Infarction (0.80 ; 0.69 - 0.93) Planned Admission (1.13 ; 1.10 - 1.16) Discharge Destination Kingston (1.76 ; 1.65 - 1.88) Hampton (3.03 ; 2.76 - 3.32) Waiting List (0.79 ; 0.76 - 0.81) Hospital Transfer (1.64 ; 1.59 - 1.70) Discharge Unit Neurosciences (0.71 ; 0.67 - 0.75) Emergency Clayton (0.92 ; 0.89 - 0.95) Medicine Clayton (0.90 ; 0.85 - 0.96) Procedures Carotid Endarterectomy (0.53 ; 0.38 - 0.75) Oakleigh(3166) (1.11 ; 1.05 - 1.17) Clayton(3168) (1.10 ; 1.05 - 1.16) Springvale(3171) (1.18 ; 1.13 - 1.25) Noble Park(3174) (1.16 ; 1.11 - 1.21) Postcodes Dandenong(3175) (1.21 ; 1.16 - 1.25) Mordialloc(3195) (1.10 ; 1.04 - 1.16) Bentleigh(3204) (1.10 ; 1.03 - 1.17) 0.01 0.25 0.5 1 2 5 10 Decreased Risk Increased Risk HAZARD RATIO Predictive at Subject level SH All Patients 1999-2001Outcome:Overall Readmissions
Logistic Regression Results (Events / N = 7,076 / 174,210) Variable (OR;95% CI) Age > 65 (0.54 ; 0.50 - 0.58) Male (0.94 ; 0.89 - 0.99) Respiratory (1.26 ; 1.18 - 1.34) History of Comorbidity At First Stroke Admission Cancer (1.97 ; 1.81 - 2.15) Heart Disease (0.93 ; 0.87-1.01) Circulatory (1.23 ; 1.14 - 1.32) Cerebrovascular (1.06 ; 0.93 - 1.22) Diabetes (1.06 ; 0.98 - 1.16) Renal (1.81 ; 1.62 - 2.02) Clayton (0.94 ; 0.87 - 1.01) Discharge Hospital Dandenong (0.96 ; 0.88 - 1.05) NE Asian / N American (0.57 ; 0.51 - 0.64) Married (1.32 ; 1.25 - 1.40) Separated/Divorced/Widow (1.20 ; 1.10 - 1.31) Carer Unknown or NA (1.32 ; 1.18 - 1.47) Planned (1.20 ; 1.10 - 1.31) Discharge Destination Kingston (0.55 ; 0.44 - 0.67) Waiting List (0.46 ; 0.41 - 0.51) Hospital Transfer (6.76 ; 6.35 - 7.19) Neurosciences (0.64 ; 0.54 - 0.76) Emergency Clayton (1.99 ; 1.85 - 2.16) Discharge Unit Emergency Dandenong (1.55 ; 1.41 - 1.71) Medicine Dandenong (0.69 ; 0.58 - 0.82) Procedures CT Scan (0.84 ; 0.73 - 0.96) Mount Waverley (3149) (0.79 ; 0.66 - 0.96) Springvale (3171) (1.16 ; 1.01 - 1.34) Postcodes Noble Park (3174) (1.19 ; 1.06 - 1.33) Dandenong (3175) (1.17 ; 1.05 - 1.29) 0.01 0.25 0.5 1 2 5 10 Decreased Risk Increased Risk Predictive at Subject level ODDS RATIO SH All Patients 1999-2001Outcome: Readmission within 7 days