Download
1 / 14

E N D
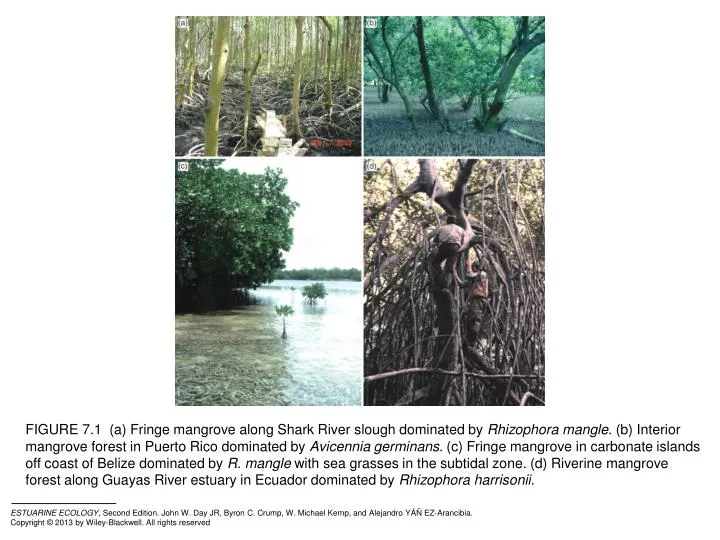
FIGURE 7.1 (a) Fringe mangrove along Shark River slough dominated by Rhizophora mangle. (b) Interior mangrove forest in Puerto Rico dominated by Avicennia germinans. (c) Fringe mangrove in carbonate islands off coast of Belize dominated by R. mangle with sea grasses in the subtidal zone. (d) Riverine mangrove forest along Guayas River estuary in Ecuador dominated by Rhizophora harrisonii.
FIGURE 7.2 Global distribution of mangroves based on Duke et al. (1998) in upper panel and Ellison et al. (1999) in lower panel.
FIGURE 7.3 (a) Seedling development showing viviparity of Rhizophora mangle and (b) cryptoparity of Avicennia germinans (Panel A is from Tomlinson 1986 and Panel B is from Chapman 1976).
FIGURE 7.4 Factorial interactions controlling the productivity of coastal wetlands including regulators gradients, resource gradients, and hydroperiod. Source: From Twilley and Rivera-Monroy (2005).
FIGURE 7.5 Adaptations of mangroves to intertidal environment. (a) Salt excretion rates for mangrove species (Tomlinson, 1986). (b) Adaptations of root structures to anaerobic environments (Saenger, 2002).
FIGURE 7.6 Hierarchical classification system to describe patterns of mangrove structure and function based on global, geomorphological (regional), and ecological (local) factors that control the concentration of nutrient resources and regulators in soil along gradients from fringe to more interior locations from shore. Source: Modified from Twilley et al. 1998 and Twilley and Rivera-Monroy (2005).
FIGURE 7.7 The geomorphological classification of mangroves by Woodroffe (2002) and ecological classification of Lugo and Snedaker (1974).
FIGURE 7.8 Mangrove biomass and net primary productivity grouped by latitude including (a) aboveground biomass, (b) net primary productivity, and (c) net production/ biomass ratios. In panel (b), yellow is litterfall, blue is wood production, and green is fine root production.
FIGURE 7.9 (a) Litter fall for 5 years at four sites in the Florida Coastal Everglades (from Castañeda 2010). (b) Summary of organic matter input (litter fall) and loss (export and decomposition) for different ecological type of mangrove based on studies in neotropics. (After Twilley et al. 1986 as modified by Mitsch and Gosselink 2000).
FIGURE 7.10 Schematic of the detrital food chain of the North River estuary in Everglades National Park. From Odum and Heald 1972.
FIGURE 7.11 Biogeochemistry pathways in mangrove forests. Source: Modified from Twilley and Rivera-Monroy 2009.
FIGURE 7.12 Survey of nutrient density (upper panel is total nitrogen and middle panel is total phosphorus) from sixty-eight mangrove sites around the world (based on mg per volume of sediment). Lower panel is the nitrogen/phosphorus ratio (atomic) of these nutrient concentrations for each respective site. (b) Survey of nitrogen fixation rates and denitrification rates based on literature values reported in Twilley and Rivera-Monroy (2009).
FIGURE 7.13 Diagram of the linkages among environmental setting, ecosystem properties, ecological functions, and uses of mangrove ecosystems, including feedback effects of human utilization on ecosystem properties. Source: Modified from Twilley (1995).