Download
1 / 17
170 likes | 180 Views
Robustness of the two-sample procedures.

E N D
Robustness of the two-sample procedures • The two sample t-procedures are more robust against nonnormality than one-sample t-procedures. When the sizes of the two samples are equal and the distributions of the two samples being compared have similar shapes, probability values from the t table are quite accurate for a broad range of distribution when the sample sizes are as small as n1=n2=5. When the two population distribution have different shapes, larger samples are needed. • In planning a two-sample study, choose equal sample sizes if you can. • Example 7.16 on page 493 in IPS. week12
Power of the two-sample t-test • The two-sample t test is one of the most used statistical procedures. Unfortunately, because of inadequate planning, users frequently fail to find evidence for the effect they believe is true. Power calculations should be part of the planning of any statistical study. Information from a pilot study or previous research is needed. • MINITAB can be used to calculate the power of the two-sample t-tests when the sample sizes are equal and the population standard deviations are equal. Commands: Stat > Power and sample size > 2 sample t week12
Example • Find the power of the two-sample t-test when the difference in means is 5, both samples are of size 20 and the common population std deviation is 6. Power and Sample Size 2-Sample t Test Testing mean 1 = mean 2 (versus not =) Calculating power for mean 1 = mean 2 + 5 Alpha = 0.05 Sigma = 6 Sample Size Power 20 0.7285 • Find the sample size (for each group) that will increase the power to 0.90. Power and Sample Size 2-Sample t Test Testing mean 1 = mean 2 (versus not =) Calculating power for mean 1 = mean 2 + 5 Alpha = 0.05 Sigma = 6 Sample Size Target Power Actual Power 32 0.9000 0.9068 week12
Comparing two proportions (two independent samples) • A university financial aid office polled an SRS of undergraduate students to study their summer employment. Not all students were employed the previous summer. Here are the results for men and women: a) Is there evidence that the proportion of male students employed during the summer differs from the proportion of female students who were employed? State H0 and Ha, compute the test statistic, and give its P-value. week12
The hypothesis to be tested are: H0: p1 = p2 vs Ha: p1 ≠ p2. • The test statistics is: where, Hence, z = -5.07 and the P-value = 2·P(Z > |-5.07|) = 0 and so we reject H0 at any significant level. week12
(b) Give a 99% confidence interval for the difference between the proportions of male and female students who were employed during the summer. • A C level CI for p1 – p2 is given by, substituting the values we get (0.9009 – 0.8101) (2.576)(0.01795) = 0.0446 to 0.1370. • MINITAB commands: Stat > Basic statistics > 2 Proportions week12
MINITAB output for the above problem is given below: Test and Confidence Interval for Two Proportions Sample X N Sample p 1 593 732 0.810109 2 718 797 0.900878 Estimate for p(1) - p(2): -0.0907690 95% CI for p(1)- p(2):(-0.12595, -0.0555881) Test for p(1) - p(2) = 0 (vs not = 0): Z = -5.06 P-Value = 0.000 . week12
Question from Final exam Dec 2000 • A SRS of 600 voters in a western Canadian province were cross-classified by income level and political party of choice in an upcoming election, with the details shown below. • Which of the following statements are true? week12
The proportion of high income earners who are liberal supporters has an estimated variance equal to: • The proportion of voters who are either NDP supporters or low income earners is estimated to be 155/600. • A 95% CI for the difference between the proportion of high income earners who are Liberal supporters and the proportion of low income earners who are liberal supporters (to the number of decimal places displayed) is : 0.111.960.095 week12
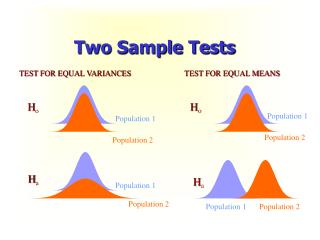
The F-test for equality of spread • Suppose that we have 2 independent SRSs from two normal populations , a sample of size n1 from N(1, 1) and a sample of size n2 from N(2, 2). The population means and standard deviations are all unknown. The hypothesis of equal spread, H0: σ1 = σ2 vs Ha: σ1 ≠ σ2, is tested by the F statistic. • The F statistic is given by where and are the sample variances. This has F distribution with n1 - 1 and n2 - 1 degrees of freedom when H0 is true. • We usually take the test statistic to be the ratio between the largest variance and the smallest variance. week12
The F distributions are a family of distributions with two parameters, the degrees of freedom of the sample variances in the numerator and denominator of the F statistic. The numerator degrees of freedom are always mentioned first. Interchanging the degrees of freedom changes the distribution so the order is important. A brief notation will be F(j,k) for the F distribution with j degrees of freedom in the numerator and k in the denominator. • The F distributions are not symmetric but are right-skewed. Because sample variances cannot be negative, the F statistic takes only positive values and the F distribution has no probability below 0. The peak of the F density curve is near 1; values far from 1 in either direction provide evidence against the H0. • To get the P-value we compare the value of the F statistic with the critical values of table E, then double the corresponding probability p. • Robustness of the F-test F-test and other procedures for inference about variances are so lacking of robustness as to be of little use in practice. week12
Example • Random samples of 8 and 10 observations were selected from populations 1 and 2 respectively. The corresponding sample variances were 7.4 and 12.7. Do the data provide sufficient evidence to indicate a difference between the variances of the two populations. • Answer: The test statistic is F = 12.7 / 7.4 =1.72 with df 9, 7 . The P-value > 2·0.1 and so we can not reject H0. week12
Questions from final Exam Dec 98 • Students in a statistics course participated in a simple experiment. The students took their own pulse rate for 1 minute. They then were asked to flip a coin. If their coin came up heads, they were to run in the place for 1 minute. Then everyone took their own pulse rate again. Some other data were also collected. Description of the data set is given below. Variable Description 1. PULSE1 First pulse rate 2. PULSE2 second pulse rate 3. RAN 1 = ran in place, 2 = did not ran in place 4. SMOKES 1 = smokes regularly, 2 = does not smoke regularly 5. SEX 1 = male, 2 = female 6. Activity Usual level of physical activity: 1 = slight 2 = moderate, 3 = a lot week12
Variable Ran N Mean Median TrMean StDev Pulse2 1 35 92.51 88.00 91.68 18.94 2 57 72.32 70.00 72.24 9.95 Variable Ran SE Mean Minimum Maximum Q1 Q3 Pulse2 1 3.20 58.00 140.00 76 106 2 1.32 50.00 94.00 66 79 • Suppose that we wished to test the null hypothesis that the mean PULSE2 rate for those who ran in place is equal to the mean PULSE2 rate for those who did not ran in place. Which of the following are true? I) It would be reasonable to use a test based on the t(90 d.f.) distribution. II) High power for the test implies that there is a high probability of concluding that the mean PULSE2 rate of those who ran in place is not the same as the mean PULSE2 rates of those who did not run in place, when in fact they are not the same. III) A type I error would be made if we conclude that the mean PULSE2 rate of those who ran in place was different than those who did not, then in fact they are the same. week12
Some more outputs: (2) Which of the following are true? I) PULSE1 rates appear to be normally distributed. II) PULSE1 rates appear to be left (negatively)-skewed. III) PULSE2 rates appear to be left (negatively)-skewed. IV) PULSE2 rates appear to be right (positively)-skewed. week12
Some more outputs: Two sample T for Pulse1 Smokes N Mean StDev SE Mean 1 28 75.0 13.5 2.6 2 64 71.94 9.70 1.2 95% CI for mu (1) - mu (2): ( -2.6, 8.8) T-Test mu (1) = mu (2) (vs not =): T = 1.08 P = 0.28 DF=39 • Now we analyze only the 35 who ran in place: T Confidence Intervals Variable N Mean StDev SE Mean 90.0 % CI Pulse1-Pulse2 35 -18.91 15.05 2.54 (-23.22, -14.61) Two Sample T-Test and Confidence Interval Two sample T for Pulse1 vs Pulse2 N Mean StDev SE Mean Pulse1 35 73.6 11.4 1.9 Pulse2 35 92.5 18.9 3.2 90% CI for mu Pulse1 - mu Pulse2: ( -25.2, -12.7) T-Test mu Pulse1 = mu Pulse2 (vs not =): T = -5.06 P = 0.0000 DF = 55. week12
(3) Which of the following are true? I) A test of the null hypothesis: “Mean PULSE1 rate for nonsmokers = Mean PULSE1 rate for smokers” vs the alternative “Mean PULSE1 rate for nonsmokers is less than Mean PULSE1 rate for smokers” has p-value 0.14. II) The 90% CI for the average change in pulse rate, for those who ran is ( -25.2, -12.7). III) If we calculated the 50% CI for the average change in pulse rate, for those who ran, it would include the value –12.5. (4) Continuing with the study above, which of the following statements are true? I) A test for a difference in std deviations of pulses (PULSE1) between the smokers and the nonsmokers would be based on F(27, 63) II) The sign test could be applied to analyze the difference posed in I) above, if we have doubts about the normality of PULSE1 measurements. III) The relation between activity level and gender should be analyzed by regression and correlation methods. week12