Download
1 / 48
480 likes | 489 Views
Credible Risk Classification. CAS Ratemaking Journal 2004 Written by Ben Turner of Farmers Insurance. Skim the Cream vs. Adverse Selection. Segmentation. As book is sliced indications become erratic, unreliable, and disrupting to policyholders. Hence actuaries opt to credibility weight.

E N D
Credible Risk Classification CAS Ratemaking Journal 2004 Written by Ben Turner of Farmers Insurance
Segmentation As book is sliced indications become erratic, unreliable, and disrupting to policyholders. Hence actuaries opt to credibility weight
“Losses Squared” • For EACH POLICY the losses are squared and then divided by the exposures of that policy. • The results can then be summed up and the underlying detail does not need to be maintained. • This allows the computation of variance without having to keep policy level detail.
Calculation of Credibility Buhlmann-Empirical-Bayes • It assumes no underlying distribution. • It is relatively uncontroversial. • It supplies its own complement of credibility. • It does not require arbitrary selection of parameters. See Loss Models, Klugman, et. al.
Calculation of Credibility Required Calculations • V = Process Variance • A = Variance of Hypothetical Means • K = V/A • Credibility = Exposures / (Exposures + K)
Calculation of Credibility Calculation of V, the Process Variance
Calculation of Credibility Calculation of A, the Variance of the Hypothetical Means
Calculation of Credibility Calculation of K and Credibility • K = V/A • Credibility = Exposures / (Exposures + K)
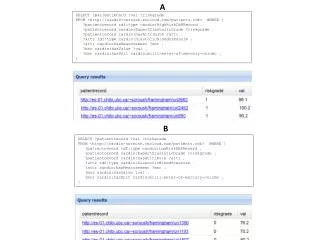
Score: Calculation of Denominator Denominator = 66,977,631,413-5,430,959,280 = 61,546,672,133
Score’s Factors An increase in any of the following, will raise Score, ceterus paribus: • The difference between the class means • The credibility of each class • The number of classes
Calculation of Score Factors: 1) Difference between means, 2) Credibility, 3) Number of Classes
Score’s Theory Score is theoretically correct because it: • Will tend to occur inadvertently via the free markets • Is designed explicitly for this actuarial issue • Uses the correct standard of proof
Complex Hypothetical Example Company introduced specialty line and tracked: • Location • Radius of operation • Whether the business is owner-operated It now seeks to create a class plan, and is willing to have the plan be nonlinear.
Conclusion We’ve seen: • Score is a theoretically correct method • Score can be done in a spreadsheet • Score can be iterated over all possible plans via a computer program • Score can be used on just the class plans that are of interest • Score can help you design superior class plans